In This Edition
1. Quotations to Open On
2. Feature Articles
2.1 PM and SE Integration – Overcoming ‘Conditioned Thinking’ by Martin Griffin
2.2 A Practical Example of the Process to Define a System Functional Architecture by Alfonso Garcia and Jose L. Fernandez
3. Additional Articles
3.1 An Economic Analysis of Software Defect Removal Methods by Gary A. Gack
3.2 Looking back: 2020-The Year-In-Review – and Looking forward: in 2021 Things WILL get Better! by Mark Evans
4. Systems Engineering News
4.1 The PPI-INCOSE Systems Engineering Tools Database (SETDB) is now live!
4.2 SysML_v2 Schedule
4.3 Systems Engineering Internship at ISAE-SUPAERO
4.4 INCOSE 2020 Product of the Year Award
4.5 Dr. Keith Willet Discusses Systems Engineering the Conditions of Possibility
4.6 Seminar Presentations Concerning Systems Engineering Concepts
4.7 Upcoming Open Training on Arcadia and Capella
4.8 INCOSE Award Nominations
5. Featured Organizations
5.1 Centre for Systems Engineering and Innovation – Imperial College London
5.2 World Organization of Societal Systems Engineering (WOSSE)
5.3 UTC Institute for Advanced Systems Engineering
6. News on Software Tools Supporting Systems Engineering
6.1 New Capella release: version 5.0.0
6.2 PTC Completes Acquisition of Arena Solutions
6.3 3SL Announces the Release of Cradle 7.6
7. Systems Engineering Publications
7.1 Tools of Systems Thinkers: Learn Advanced Deduction, Decision-Making, and Problem-Solving Skills with Mental Models and System Maps
7.2 Clean Architecture: A Craftsman’s Guide to Software Structure and Design
7.3 What Is a Complex System?
7.4 Introduction to the Theory of Complex Systems
7.5 INCOSE Model-Based Capabilities Matrix
7.6 Systems Thinking: Managing Chaos and Complexity: A Platform for Designing Business Architecture
8. Education and Academia
8.1 Master’s in Systems Engineering Leadership at Worcester Polytechnic Institute Worcester, Massachusetts USA
8.2 New Technology and Team Driven Innovation Certificate Program University of California Irvine (USA) Division of Continuing Education
8.3 Internet-Based Testing for Students and Professionals
9. Some Systems Engineering-Relevant Websites
10. Standards and Guides
10.1 SESA Involvement in Systems Engineering Standards
10.2 ISO/IEC/IEEE 15288:2015 Systems and Software Engineering – System Life Cycle Processes
10.3 SAE International Launches OnQue Digital Standards System
11. Some Definitions to Close On
11.1 Performance Measurement
11.2 System Integration
12. Conferences and Meetings
12.1 The 11th Israeli International Conference on Systems Engineering
13. PPI and CTI News
13.1 PPI’s Updated Definition of Systems Engineering
13.2 PPI Welcomes John Fitch
13.3 Team PPI Attends the INCOSE International Workshop
14. PPI and CTI Events
15. PPI Upcoming Participation in Professional Conferences
1. Quotations to Open On
Having subsystem developers define their own requirements is the engineering equivalent
of anarchy (unless the subsystem developer is responsible, accountable,
and qualified to design the parent system).
![]()
Launching rockets is easy; getting engineers to agree on standards is hard.
Wayne Hale
![]()
Only a crisis, actual or perceived, produces real change.
Milton Friedman
2. Feature ArticleS
2.1 PM and SE Integration – Overcoming ‘Conditioned Thinking’
by
Martin Griffin
Systems Engineering Society of Australia[1] (SESA) Defense and Aero Lead
![]()
February 2021
Abstract
Conditioned Thinking is a human trait and although we are all too quick to deny that our decision making is influenced by something beyond our direct control, it is an undeniable fact and if you accept that as a given then you allow yourself to understand, or even appreciate, how others are thinking.
“Tradition, long conditioned thinking, can bring about a fixation, a concept that one readily
accepts, perhaps not with a great deal of thought.”
Jiddu Krishnamurti
“One believes things because one has been conditioned to believe them.”
Aldous Huxley, Brave New World
In the context of project or program delivery, every organization that pursues this type of societal endeavor is inevitably confronted with today’s reality of project failure; most are left wondering, how did it happen? For those aspiring to high levels of process maturity, they undertake ‘lessons learned’ and root cause reviews with resulting process improvement initiatives but rarely (if ever) would the auditing highlight ‘because of Conditioned Thinking’. So as each discipline or Integrated Project Team (IPT) tries to ascertain the process that wasn’t quite adhered to or the point at which reality started to deviate from the plan, unconscious bias is still inherent; without fail the human nature influence starts finger pointing or worse and the already existing inter-disciplinary rifts are further engrained through more process and ‘clearer lines of accountability’ intended to prevent recurrence – unfortunately, these actions only increase the likelihood and perpetuate the problem.
PMI and INCOSE studies from 2011 to 2014 identified the concept of ‘Unproductive Tension’ between the two more prominent disciplines of program delivery, Program Management and Systems Engineering. The issues were comprehensively captured in the book, Integrating Program Management and Systems Engineering [Rebentisch, 2017]. But what these studies didn’t delve into was that each of the practitioners associated with their respective disciplines had been ‘conditioned’ by their training and also by the organizational constructs they were required to operate within; the root cause of the unproductive tension is the coalescence of disconnected view-points and a divergence of technical language.
This paper extends from the previous work presented in the PPI SyEN Issue 72, December 2018,
“Integrating Program Management and Systems Engineering”, which explored the historical evolution of Program Management and Systems Engineering and their subsequent divergence. The focus for this paper is to further explore the paradigm of ‘Conditioned Thinking’ within program delivery; provide elaboration on the conclusions from that earlier work to assist with identification of the limiting constructs within any delivery-focused organization; and provide guidance concerning how to overcome the ‘Unproductive Tension’ resulting from this ‘conditioning’.
Copyright © 2021 by Martin Griffin. All rights reserved.
Introduction
The previous paper[2] surmised that the root cause of poor integration of Project Management and Systems Engineering is actually ‘constrained thinking’. This is an outcome of conditioned thinking whereby the ‘conditioning’ has limited the person’s beliefs and understanding to a constrained and somewhat prescriptive set of processes and allowable actions. In later sections, specific examples of this will be detailed for both disciplines to show how the resulting unproductive tension arises. Further to the identification of this root cause, the previous work identified the following list of integration issues as particular areas to be explored and these will be elaborated throughout this paper:
- Human Nature: Conditioned or Local Mindsets
- Communication: Speaking a different language
- Culture: Process Compliance – Resistance to Change
- Environment: Industry norms – e.g. Rail Standards
- Societal: Business practices – Contracting methods
- Organizational: Organization structure with Role definitions
For the Systems Engineering (SE) discipline, the constrained thinking usually takes the form of automatically (blindly) applying the full process models associated with requirements management and design synthesis, and inevitably gold-plating or over-prescribing system functionality at the expense of budget and schedule.
For the Project Management (PM) discipline, the constrained thinking is regularly exhibited in the forced delivery of immature contract deliverables to achieve a contractual milestone in order to release an associated contract payment at the expense of rework and technical non-conformance, and the inevitable realization of technical risk toward the end of the project.
The unfortunate reality in modern programs is that almost every project experiences both of the above constrained thinking outcomes in parallel and concurrently, and therefore the personal experiences of the teams’ allocated responsibilities associated with either discipline is ‘unproductive tension’. The project manager is eternally frustrated that the technical team continuously attempts to develop technical products and deliverables beyond the cut-off date for peer reviews and quality checks. And the engineering manager is annoyed that the members of the project management team are rushing (and often bypassing) review activities in order to release deliverables which inevitably have to include caveats and disclaimers regarding incomplete technical activities.
When one overlays organizational culture onto this team division you start to see behaviors emerging that can be unique to just specific companies or even industry sectors. For example, project managers being rewarded and specifically singled-out for accolades related to achieving early project milestones through heavy-handed suppression of technical leads, even though the project is on a path to over-runs and reputational damage. Even the simple act of creating program role hierarchies where the program manager is the single point of accountability with direct upward reporting to company directors or Chief Executive Officers (CEOs) and downward line authority to Integrated Project Team leads (usually Project Managers [PMs]) with technical leads relegated in the hierarchy to layers not able to influence the budgets or work packages assigned.
At first glance these aspects may appear to be simply poor role definition or misaligned accountability assignment, but these cultural ‘norms’ within organizations become so deep-seeded that the conditioning of the delivery teams goes beyond their discipline training to become fixed (constrained) beliefs extending from one failed project to the next. Most of those involved in ‘delivery’ programs are all too familiar with statements similar to the following quote from an Australian Company Director of a renowned rolling stock organization when queried as to why the rolling stock could not be commissioned on infrastructure that had been delivered to schedule:
“For all new train projects, especially of this size and complexity, it is not uncommon to experience some
delays as issues are identified during testing and rectified accordingly.”
Now this would seem like a reasonable argument (excuse) if the delays were minor and rectification effort associated with the issues manageable within planned risk margins; however, time and again the media reports on Government infrastructure programs being delayed by multiple years and costing billions of additional taxpayer dollars – this recurring phenomenon suggests that “not uncommon” is a deep-seeded cultural norm. For the project related to the comment, the resulting ‘issues’ that needed to be ‘rectified’ were redesign of the platforms and major modifications to the rolling stock, including creating separate configurations resulting in significant delays to entry into service. Yet the project proceeded past the Detailed Design Review with accolades regarding achievement of an early milestone and early entry into testing.
Thus, at the core of this integration challenge is the ‘constrained thinking’ originating from process- driven technical standards developed by the respective industry representative bodies (INCOSE and PMI). The standards, including ISO 15288 and ISO 21500 (or the more commonly applied Project Management Body of Knowledge (PMBoK) and PRINCE2[3]), are a necessary construct as they enable the ‘principles’ associated with the ‘methodologies’ to be documented in a way to permit consistent application by practitioners, and hence they are common taxonomies and terminology utilized throughout industry. Unfortunately, they also, intentionally or otherwise, prescribe processes to be adopted and adhered to in order for organizations to claim delivery methodologies ‘compliant’ to the standard. The previous paper details how these two specific methodologies evolved and consequently diverged in principles application – this highlights the modern dilemma – the practitioners of each discipline have little to no familiarity with the other’s application. The end result is that today’s project managers pursue execution of the contracted scope of work and deliverable lists at the potential expense of a successful capability. And today’s systems engineers hone and refine requirements until they are not practically achievable within the contracted budget and schedule.
There is a common theme of practitioner conditioning constraining the individual’s ability to consider or adopt other points of view related to any business objective, in particular the delivery of a customer’s needed capability or service. An answer proposed by the PMI-INCOSE-MIT collaboration[4] was to educate the practitioners of the two disciplines to increase awareness of the other’s practices. This might go some way to reducing the ‘constrained thinking’; however, it would not alleviate the ‘conditioned thinking’ and is highly unlikely to alter an individual’s application of their own trained beliefs. The operative critical questions are: what options exist to bridge the chasm, and what can actually integrate the actions and endeavors of diverse multidisciplinary project teams to effect successful delivery outcomes?
Conditioned Mindsets – What were they thinking?
Project Managers are not all created equal and even if they have undergone the same training and certification courses, the on-the-job element of their knowledge development directly influences how they apply that training. Looking at a key PM aspect of work decomposition, which involves converting scoping statements to work packages and the associated Work Breakdown Structures (WBS), most PM practitioners would tackle this task slightly differently. The one consistent theme however, driven by their conditioning, is to create these packages directly from the contract Statement of Work (SOW) in a way that they can be apportioned to a specific team. There is a strong focus on deliverables specifically referenced by the contract (see Figure 1) and a dogmatic view-point of allocating deliverables associated with specific disciplines to those specific teams – for example, a design documentation package allocated to an engineering team deemed responsible for design. This assumes the allocation of responsibility for the estimation of budget and schedule as well.
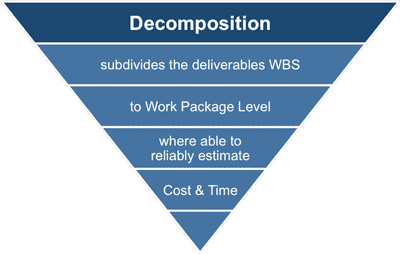
Figure 1 – Project Management Construct for Work Decomposition
The resulting first-cut of any work decomposition activity using a Project Management conditioned mindset is therefore a siloed and disjointed WBS based solely around project deliverables as specified in the SOW. Figure 2 shows a generic hierarchical WBS – what transpires is that each vertical element gets ‘chunks’ of scope dropped-in that are related to a particular discipline/team. For example, one column would be PM tasks and another engineering tasks and another build tasks and yet another would be verification tasks and so on.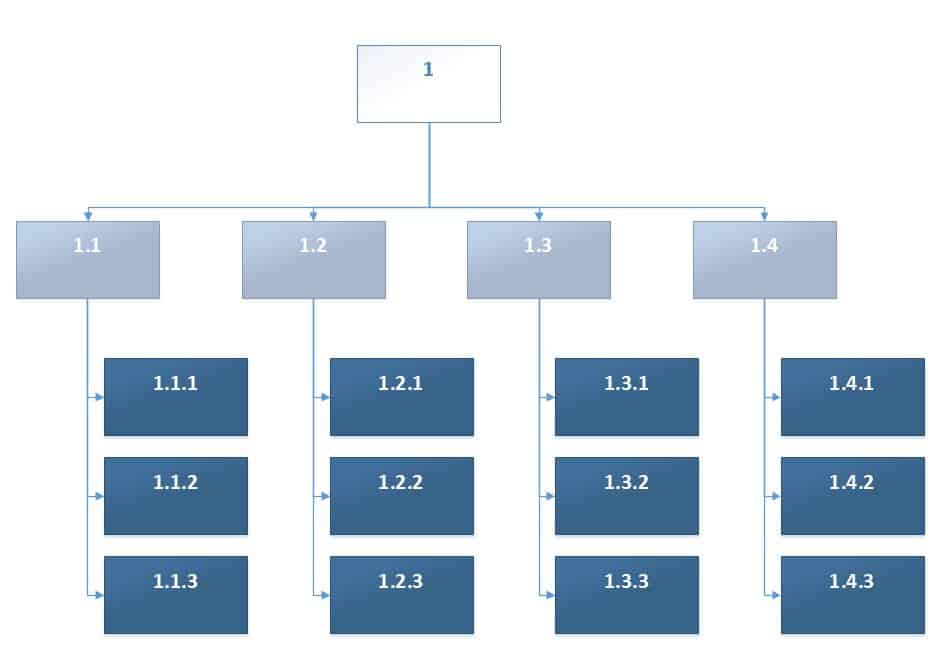
Figure 2 – Generic Work Breakdown Structure Construct
For projects that are large enough to support Integrated Project Teams (IPTs) this same approach is applied and the IPTs that are formed are discipline-based – they become silos within the broader organization, thus defeating the benefit that was originally intended with creating “integrated” teams.
The following example, Figure 3, is a generic structure that usually occurs within the rail industry and clearly shows the conditioned thinking when translating the SOW into a WBS. In this case the scope associated with Rolling Stock (R/S) gets ‘cherry-picked’ out and assigned to the R/S IPT; the scope associated with track and infrastructure gets assigned to the track IPT; and the scope associated with the depot goes to the respective IPT. This conditioning is so engrained that because the SOW mentions that systems engineering is needed, an entire siloed Systems Engineering IPT gets created so that those associated deliverables have a location in which to ‘live’ and someone responsible to deliver them. Consistently, these programs have integration issues at delivery so significant that entire systems have to be re-engineered.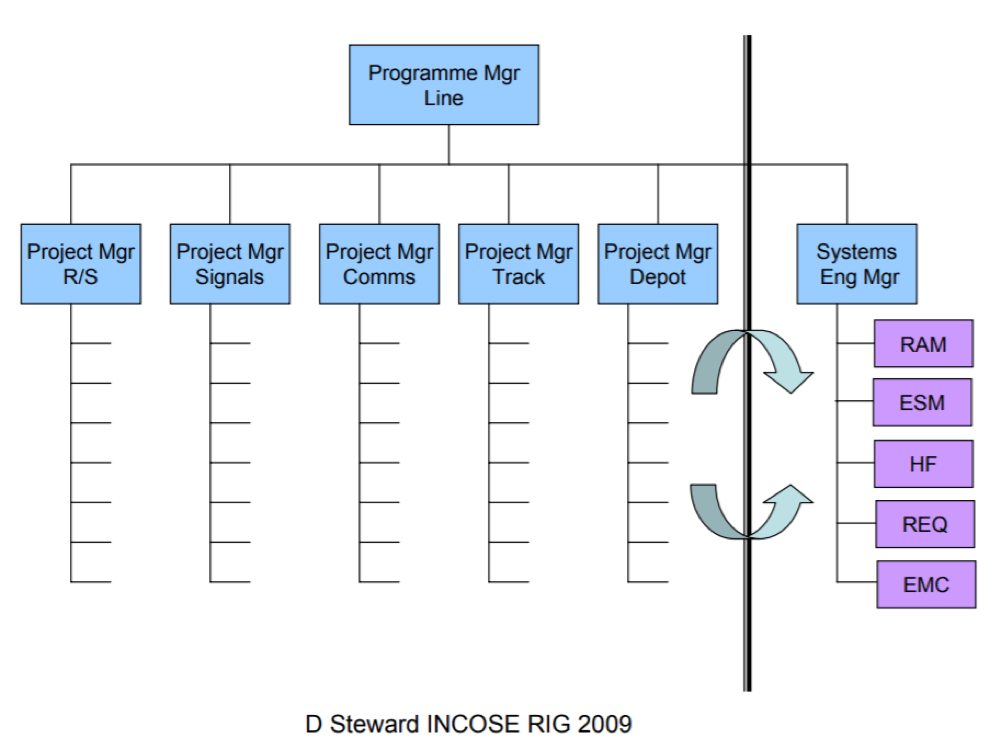
Figure 3 – Generic Representation of Rail Industry IPTs
Now extend the thinking to programs where the work is being delivered across multiple organizations and the conditioning is still so pervasive that the IPTs become company specific and it is so difficult for PMs to consider the concept of ‘shared work’ or IPTs consisting of employees of the different companies. Even when the work scope is highly inter-dependent across these IPTs, the conditioned thinking forces the conjuring of alliance contract models and cross-team teams which don’t actually have any affect at the work package level, because the ‘work’ is not decomposed in a way that permits effective deliveries across the various teams. The recent ‘project of concern’ within Australian defense associated with delivering the three Air Warfare Destroyers (AWD’s) had an IPT construct as shown in Figure 4 and the magnitude of rework and churn and inter-dependence delays directly resulting from this SOW decomposition was mind-boggling. If you look closely you will notice that there is no Systems Engineering IPT even though defense scopes are predominantly built around these principles; but do not fear, the Engineering Cross Product Team got allocated ALL of those deliverables in the early phases and the Support/Sustainment IPTs were allocated the later deliverables. Needless to say these were not actually integrated and most support deliverables were created in isolation from the design ones.
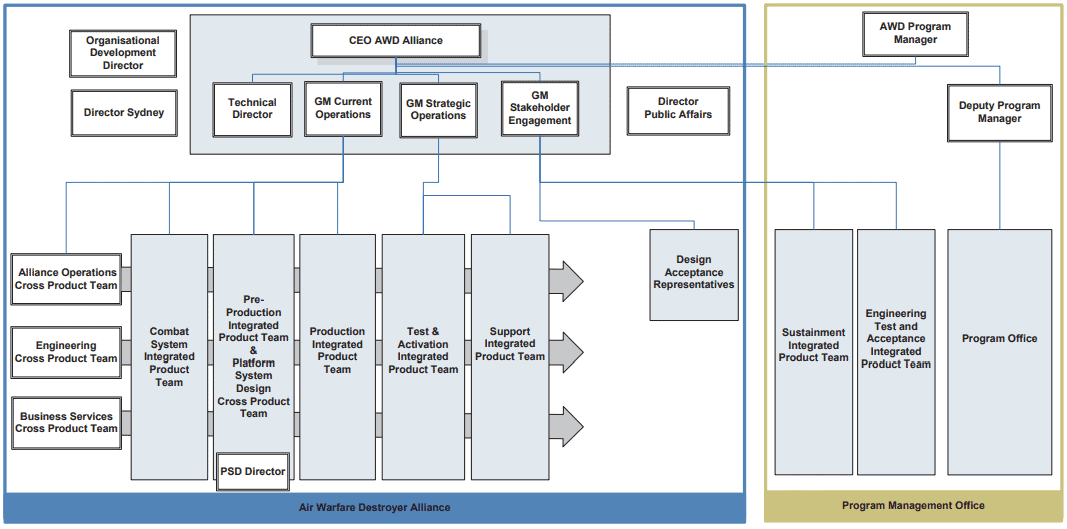
Figure 4 – Air Warfare Destroyer (AWD) Design and Build IPT Construct
Of course, none of the above is helped by the Customer’s formation of the Contract, and it is not coincidental that the disciplines engaged to create the SOW are actually project management practitioners who have all undergone the same conditioning. Thus, contracts that directly link payment milestones to deliverables due at specific schedule milestones are encouraging and actually enforcing the decomposition approach taken by those PMs planning the work. The same conditioning has those Customer practitioners ‘ticking the box’ at each milestone to indicate that the ‘deliverable’ has been received and therefore that gate can be passed even though there is little to no evidence that a solution is converging or that the project outcome will be still achieved.
Speaking a different language – What you talkin’ ‘bout Willis
In any given industry there are specific taxonomies or definitions which are specific to the industry and would not be known by individuals working in other industries. The same can be said within certain organizations where the process models attract internal colloquialisms, and these quite often filter down from customer terminology to the terminology used by the suppliers. Additionally, most (if not all) professions attract their own ‘languages’, where individuals in other professions would struggle to understand the meaning or context of use. Between the two disciplines referenced in this paper, this difference is quite palpable and regularly leads to issues in achieving a successful project outcome. The previous paper explored the historical divergence that has led to these significant ‘language’ challenges but there is no clear resolution to this in today’s programs.
It is important to clarify where the language confusions are leading to ‘unproductive tension’ and/or miscommunications. Both disciplines get engaged under the same contractual mechanisms under any given program, so it would be expected that the contractual language and terminology (used by a customer) would take precedence and therefore avoid these inter-discipline issues. What actually transpires is that the Contract uses mixed language because the individuals putting the SOW together are practitioners of each discipline who don’t understand why the other is referring to a particular term. Further the Contract infers responsibility and/or accountability for certain scope and deliverables which gets interpreted as ‘done in accordance with that discipline’s processes’. The Contractual nuances will be explored later in this paper; however, some specific areas causing confusion are listed below:
- Data Management vs Configuration Management vs Contractor Deliverable Requirements List
- Major System Reviews as part of the Systems Engineering Program
- Contract Master Schedule vs Engineering Schedule
- Function and Performance Specification vs System Specification vs Product Specification
- Monitoring and Control vs Measurement and Analysis vs Earned Value Management (EVM)
- Contractual Requirements (for example, Statement of Requirements) vs Technical Requirements
Even when the Contract is clear with its references or definitions of terms, what gets actually submitted by a company as a ‘compliant’ proposal can lead to language issues. For example, the contract may have required a Systems Requirements Validation activity and also requested an initial draft of a System Specification (which would normally be an output of the activity). The company’s submission may assume that their proposed solution is ‘accepted’ by the Customer as compliant to the System Specification if they get awarded the contract, and so the PM starts planning to build that product, but the Engineering Manager is planning to analyze the requirements and modify the product where not compliant. Another potential outcome is that the Engineering Manager begins requesting technical data related to a product to produce Objective Quality Evidence to support a compliance statement but the PM over-rides the request to the sub-contractor stating that the compliance is assumed.
The majority of language issues originate from the processes described within the particular standard used to train (and thereby condition) the practitioners. These same issues exist even within the disciplines themselves, based on what training or certification the person has. Within PM there are process differences between ISO 21500, PMBOK & PRINCE2, leading to slightly different approaches taken by these practitioners and within SE there are differences between ISO 15288, EIA-632, and others such as the obsolete MIL-STD 499. The project lifecycle models shown in Figure 5 have a Systems Engineering model based on EIA-632 which references a Critical Design Review (CDR) which has a significantly different objective then a Detailed Design Review (DDR) which is more prominent within the ISO/IEC 15288 approach. To a PM these two review types are exactly the same and this is one of the most prevalent areas of unproductive tension within a delivery project. In this instance a CDR triggers an approval process with the Customer to permit the ‘start’ of production activities and may require a number of prototype builds to have occurred and undergone testing to validate design decisions or to de-risk some unproven technology. This would usually be followed by a Production Readiness Review (PRR) at which the detailed drawings and production prequalification data would be presented to get approval to start building or installing. A PM can easily mistake a DDR to mean a similar thing, only to be faced with a customer demanding detailed production drawings in order to ‘verify’ the design.
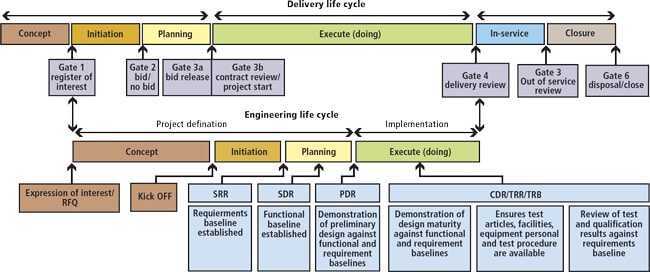
Figure 5 – Traditional Representation of Phases and Review Gates
Process Compliance
On large projects of long duration and with many teams working to produce the required outcome, having well developed and detailed processes is necessary to ensure consistent and effective delivery and to assure an acceptable level of quality of the related deliverables. Even on shorter duration, agile team projects, having processes to work to provides a level of confidence both internally for the team and externally to the customer. The challenge, of course, is to ensure that the processes adopted are suited to the type of project and are able to dovetail into any external dependencies (for example, product suppliers) and also with the customer as the end recipient of the project’s outputs.
For the most part, a company supplying to a customer will have established their processes to ‘mirror’ those of their customer. So a company who delivers projects to customers who use systems engineering for their capability definition and whole of life support, would likely have project lifecycle models developed based on systems engineering principles. These companies will also have adopted the SE approach of ‘tailoring’ whereby certain process steps will be mandatory to ensure a legal obligation or an auditing need is met, while others will be allowed to be tailored within certain guidelines or parameters. Unfortunately, this tends to be done at the commencement of a program and based on the Contract SOW and turns out to be not suited for later parts of the program, or worse, that it includes process steps just because the SOW referred to it but there is actually no scope requiring the process. Also, through the course of a Program, many employees join and leave and so the original tailoring basis is lost. Quite often, the processes applied to a project are just taken as gospel from the company’s Business Management System (BMS) and are applied on the basis of ‘this is a requirement of the BMS’. Another regular occurrence is that during a project quality audit the quality team identifies BMS processes that they believe are applicable (because they are being used on all the other projects) and they put a Corrective Action onto the program which gets executive level visibility and the PM team just agrees to add it in order to make the issue go away.
So at the first process layer for any Program there is only a low risk for mature organizations of incurring unproductive overhead related to process adoption. However, at the next layer or lower levels of process, the conditioned thinking begins to ‘kick-in’. When looking at the application of System Requirements Validation (refer to Figure 6), the company’s BMS might have clearly defined processes identifying the tools to be used (and even when certain tools requiring dedicated skilled users should be applied) and it might detail the required level of traceability between customer specifications and final product specifications. But at the next level of process where the method of requirements derivation and design synthesis occurs, the BMS would likely just point to some best practice or Community of Excellence (COE) examples from other projects. It is at this level that the expertise of the individuals appointed to the applicable role becomes relied upon and these processes or work instructions get developed specifically for the project. And it is here that the conditioned thinking causes a compliance mentality that constrains programs and can lead to requirements being developed that are not actually implementable with the concept solution or not verifiable because they are unbounded or untestable.
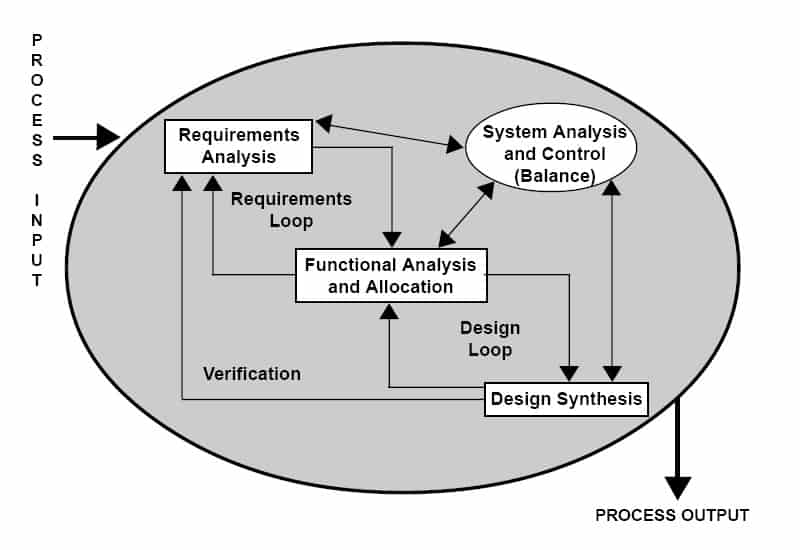
Figure 6 – Traditional Requirements Validation Process
A very common occurrence is an unwavering belief that FPS requirements must be taken through to the System Specification even if that requirement is listed as ‘desirable’. Worse still they get ‘copied’ word-for-word into the specification and no analysis or feasibility studies get performed because this part of the project is schedule constrained by the PM because it is seen as a purely paper-based activity. The PM team is expecting the responsible engineers to produce contract deliverables (not un-scoped analysis papers) and generally aren’t aware of the technical implications associated with this activity because they are purely focused on achieving that project milestone. If the engineering team raises any concerns that the requirements may be difficult to achieve, they will quite often be told to not raise any issues with the customer at this early stage because it might infer that the proposed solution wasn’t suitable, and everyone proceeds ‘hoping for the best’ (although the ‘Unproductive Tension’ increases). If the project ‘gets lucky’ and the particular requirement gets transferred into an external SOW to be tendered by Sub-Contractors, they may get informed that the requirement is not achievable or get an unexpectedly high quotation, identifying the over-prescribed requirement. But more often this slips through the cracks until the product is built and it has reached the testing phase and found to be ‘non-compliant’.
Another trend that has been emerging in recent years is the transfer of processes from one industry to another. With the realization that programs are becoming more complicated and even complex with interoperability across systems and the interdependence between systems (for example, Industry 4.0), industry sectors that previously hadn’t used formal systems engineering, are now adopting a more formal approach. To achieve this, they are recruiting experienced engineers from sectors familiar with these principles (for example, transport is recruiting from defense) and asking these practitioners to create processes to integrate into their existing business practices. In reality what they are doing is inheriting conditioned thinking. For the example of transport inheriting from defense, they are inheriting a legacy of over-prescribed MIL-STD process that is tolerated in the defense sector but is really not suitable for overlaying on the siloed, standards driven, transport sector.
Industry Norms – designed to standards
Rigid adherence to design standards is another form of conditioned thinking, and in the same way that compliance to process can overly burden a project and drastically increase the unproductive tension between SE and PM, so too does a culture insistent on complying to standards. The original creation of these industry standards (or perceived industry norms) was generally a reaction to safety incidents or serious accidents or as a means of capturing and sustaining best practice and ‘rules of thumb’. They were first introduced as conditions of contract solely between the customer and supplier. In most industries or sectors they evolved to become treated as ‘the bible’ for a particular discipline on a specific design topic. The more prolific application can be seen in the construction, railway and automotive industries, but they are also prominent within the sectors of healthcare and maritime. As a result of these standards becoming ‘adopted’ as the ‘industry norm’ for any given application, they require ongoing maintenance and upkeep – this spawns technical societies and safety-boards whose primary role became the administrators of the content and currency of these standards. In some specific scenarios the industry regulators (safety or operations) inherited the responsibility and those standards attracted a further stigma of requiring compliance in order to achieve accreditation to use or operate the system, plant, facility, or full capability. Each country recognized a need to ‘police’ this activity, since most organizations (especially Government organizations) sought to take advantage of existing standards; thus associations (like Standards Australia) were established and then affiliated with other global groups under defined charters.
It is important to recognize the efficiency gained through common reference to an ‘accepted’ standard; however, it is far more important to recognize that those standards were developed to a meet a specific need under specific conditions and should only be used as a source of applicable requirements to ‘adopt’ on a Program for any of the lifecycle phases of design, build, operate, and dispose. The all-too-common occurrence in any project is to take an FPS statement such as ‘the system shall be compliant to the electrical wiring standard AS3000’ and directly copy that into a system specification and duplicate it to all of the product specifications. This immediately triggers ‘conditioned thinking’ from all affected practitioners. For example, the product supplier confirms ‘our products are AS3000 compliant’, the electrical designer completes a set of electrical drawings using their AS3000 training, and the installer ensures they wire and protect all equipment using the AS3000 principles. And then, during commissioning, the testers alert the identification of numerous earth faults, and worse still, a commissioning technician receives an unhealthy dose of electrical current when they lean against a perfectly AS3000 earthed, electrical cabinet. Everyone missed that the ‘ship’ was configured as an ‘insulated neutral’ distribution network, since they were too busy procuring, designing, and installing in accordance with the standard.
As a design authority, the number of conversations had with design practitioners who state, quite passionately, “It is safe because it is compliant with Standard X” is quite concerning, but in some industry sectors this is the ‘Norm’ and it is the design authorities who are making that statement to regulators. It is therefore easy to understand why regulators are moving (quite quickly) to a position of requiring ‘Assurance’ from designers and integrators because these organizations were all too eager to say ‘we designed/built/installed to the “standard” requested by the regulator’. The only problem with requesting ‘Assurance’ is that this has a multiplication effect on the ‘unproductive tension’ within the delivery team. The PM’s have not altered their work decomposition approach (except for potentially introducing an additional work package called ‘Assurance’), nor have they sought to understand what additional ‘non-scoped’ technical activities may be needed, and it would be quite rare to find a contract clearly differentiating the type of deliverables needed as a result of this regulator side-step. And the technical teams (including systems engineers) still reference their ‘religious’ standards in sweeping (usually unsubstantiated) compliance statements, and now argue about what ‘Assurance’ actually means. But the organizations that are now ‘exposed’ to potentially increased liability and that can no longer seek comfort in the regulators ‘advising’ what to do (because they are now acting as auditors), apply yet another layer of governance by creating or appointing Assurance Managers and usually an entire Assurance team.
A recent example of the pitfalls associated with designing to standards in the new regulatory environment is the Boeing 737MAX disasters. Due to legal sensitivities it is not possible to elaborate on the specifics associated with this case study however the recent technical review into the Boeing 737 MAX accidents (Joint Authorities Technical Review (JATR) – Boeing 737 MAX Flight Control System – Observations, Findings, and Recommendations) uncovers many of the cultural norm issues discussed in this paper and it is publicly available.
Business Practices – Contracting Methods
Because the preceding sections suggest the need for continuous improvement of delivery programs, it would seem appropriate to identify a few specific areas of where organizations have delivery challenges, and then offer suggested Corrective Actions (in accordance with ISO9001) for executives to ‘pass-down’ to their lead teams to enable them to roll-out a Change Management program (ADKAR[5] is gaining popularity) to monitor progress. However, when a significant contribution to the PM-SE Integration challenge is caused by the customers who are requiring the delivered outcome, then it becomes apparent that modern day business paradigms, that now resonate like broken records, are unlikely to be able to bridge the rift within most delivery organizations.
Contracting methods come in a vivid array of types and styles and can also vary significantly across industry sectors. They can range from Fixed Price with Fixed and explicit Scope through to Time and Material with variable scope agreed at set gates. For a large number of public infrastructure delivery programs, the current preferred method is Public-Private Partnership (PPP), which in its own right has numerous constructs for actual delivery of the required outcome. There is generally one aspect which is consistent, regardless of the contracting method – the Need Statement or Statement of Requirement which defines or describes the required capability or service to be delivered.
For most industry sectors, there is a common approach preferred by any given customer, which is based on how that customer manages its lifecycle approach to its assets or resources. In the Australian Defense Force (ADF), there is a Capability Life Cycle (CLC) model, which is supported contractually by the Australian Defence Contracting (ASDEFCON) framework. For Australian Government, it tends to be managed at the state level with Victoria using the Investment Life Cycle and High Value and High Risk Guidelines (refer to Figure 7) which defines capabilities. Victoria has also established the Office of Projects Victoria, which is intended to provide independent advice and project monitoring to achieve successful project delivery. All of these Lifecycle models have a dependence upon project management, and the contracting mechanisms explicitly require formal PM to be undertaken.
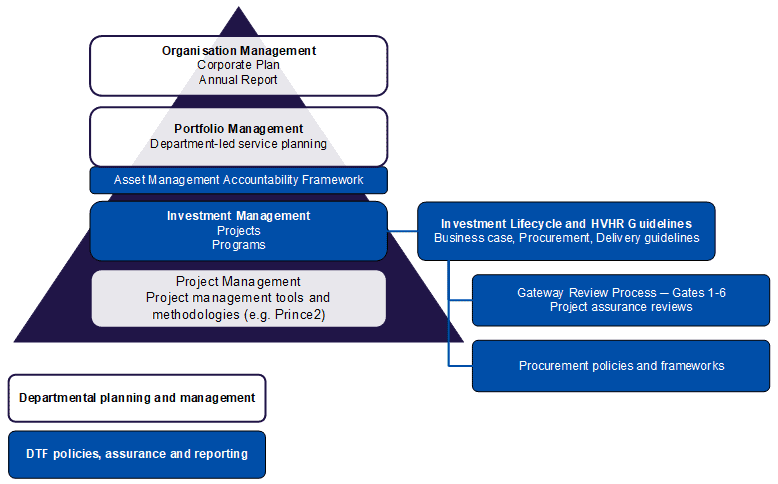
Figure 7 – Victorian Government Investment Planning and Management Framework
As highlighted in previous sections, the dependence upon PM practice means that PM practitioners are engaged to develop and construct the contracts; due to their conditioning, they create Statements of Requirements that explicitly require ‘deliverables’ at key milestone gates and link payment of the contract progress to acceptance of these deliverables. Even for quite mature Lifecycle models as found in the ADF where Operational Concept Documents (OCD) are produced that define the capability outcomes in very clear terms, the contracts, including payment and penalties, are inextricably formed around deliverables at Mandatory System Reviews (MSR). There is reference to achieving the intended outcome and sometimes direct reference to the OCD, but without fail the Contract is linked to delivering documentation and material procurement with penalties able to be applied if the MSR milestones are delayed. Thus, the dutiful PM’s engaged to manage the contract follow their training and focus on getting deliverables out the door and exiting MSRs with the minimum of conflict. After all, they are nominated within the company organization structure as the ‘accountable’ person and they are directly pressured when the cash flow is not to plan or a large milestone payment slips outside of an annual planning cycle. Inevitably the schedule is reported as on track, right up until the point that the delays can no longer be ignored/hidden and the capability just can’t be fielded the way it was planned.
Organization Structure
The structure of an organization has a direct effect on how projects are delivered, and most organizations will vary their structure quite often (for example, every few years) as the nature of work being conducted changes. For example, a ship building organization that engages in large defense contracts may swing to a heavy project-based structure as programs are won and ramped-up and then back to functional-based constructs as the large program completes and resources need to be ‘shared’ across smaller programs. Or a similar sized ship building company that concentrates on the commercial market and consistently produces a multitude of ship variants, may use a functional construct which changes to a Matrix style varying from strong to weak Matrix as contracts are won and completed.
The following models show the generic concepts of each of the construct hierarchies with project delivery indicated by the dotted lines. A brief description of how each is used is provided with a high level description of how conditioned thinking can surface within these environments and how that impacts on unproductive tension between PM and technical leads (particularly systems engineers).
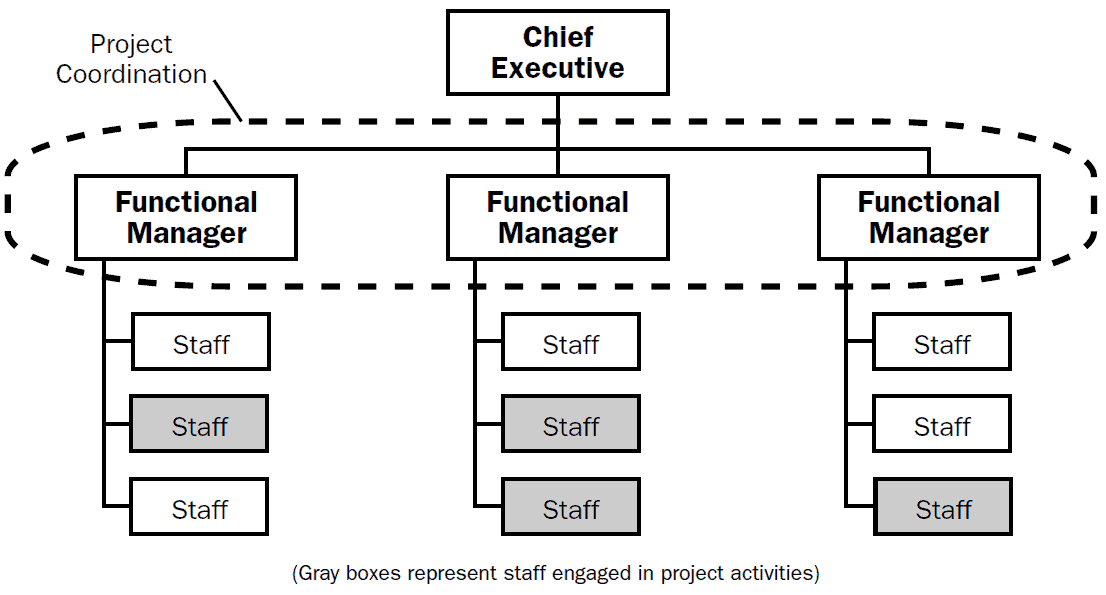
Figure 8 – Functional Organization Hierarchy
The functional structure is prevalent within companies that have a large number of usually less complex programs of work and where that work effort contributes either to the Company’s overall objective or the cumulative completion of work output. Each Functional Manager is aware of all programs occurring within the company and distributes and balances their allocated resources across each project within those programs. These managers are also responsible for understanding the level of expertise required to be maintained in order to deliver on any upcoming planned works.
In these structures, PMs can actually be one or more of the functional leads who are allocated specific projects to manage and deliver. Generally, if a dedicated PM is engaged, then the model is transitioned to more of a Matrix style (see below), where the PM would then engage each functional lead to secure access to specific resources. For purely functional hierarchies the vertical divisions (functions) can readily succumb to silo mentality and try to apply a ‘one-size-fits-all’ procedural approach which can be effective for service delivery but rarely for project delivery. The unproductive tension is not just between the PM and technical lead, but also between silos, and conditioned thinking can lead to entire functional groups being bypassed or even that related scope being outsourced to contractors.
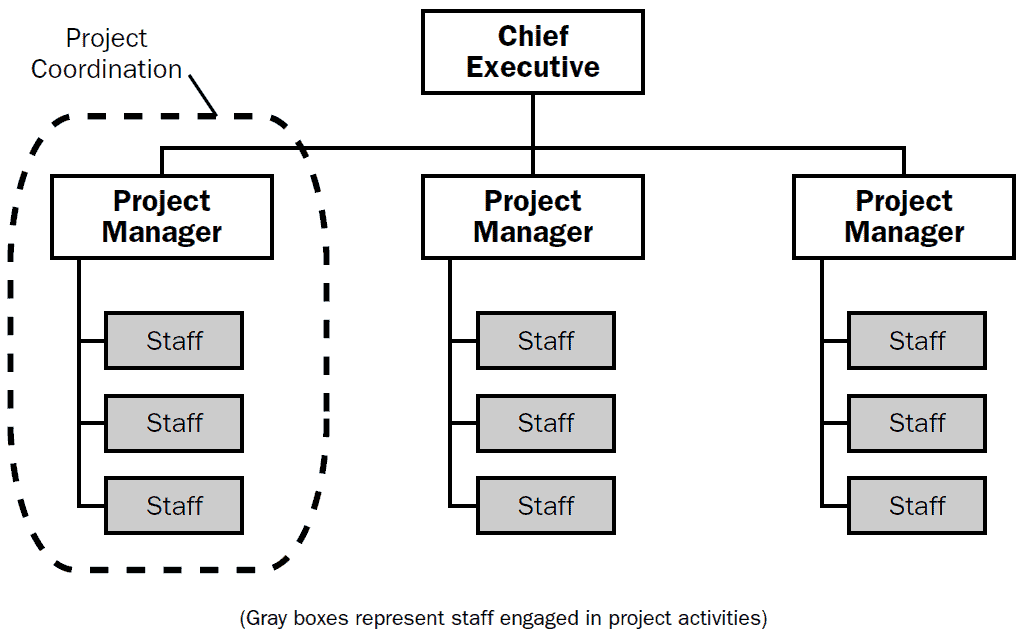
Figure 9 – Project Organization Structure
Within a project-based hierarchy, a series of relatively independent project teams (which can take the form of IPTs) are established, and the program portfolio is distributed among these teams. For larger, purely project delivery organizations, this structure ends up as separate teams per company contract. This is usually seen as an efficient way to organize for project delivery, since the teams can be trained specifically for the contract requirements, and processes can be tailored for the defined scope. Unfortunately, what tends to occur is that teams roll from one contract onto the next and replicate all of the process from the previous contract and adjust (rather than tailor) the processes. The PM’s are given complete autonomy to hire and fire staff and will regularly ramp up new resources to meet their emergent needs, without regard of the needs for resources of future projects.
In a Project based hierarchy the conditioned thinking comes with the resources engaged, either from prior contracts or from prior organizations. A very common result is ‘reinventing-the-wheel’ where the project teams are so disconnected from the broader organization that they develop their project plans in complete isolation and usually from first principles of their respective domains. The unproductive tension in these structures is the result of independent planning within the teams themselves because the PMs will develop their own plans and delegate to discipline leads to develop their own plans. In these companies, it is quite common to see multiple processes running in parallel that are trying to achieve the same thing (for example, PM lifecycle, SE lifecycle, logistic/support, production, and asset management).
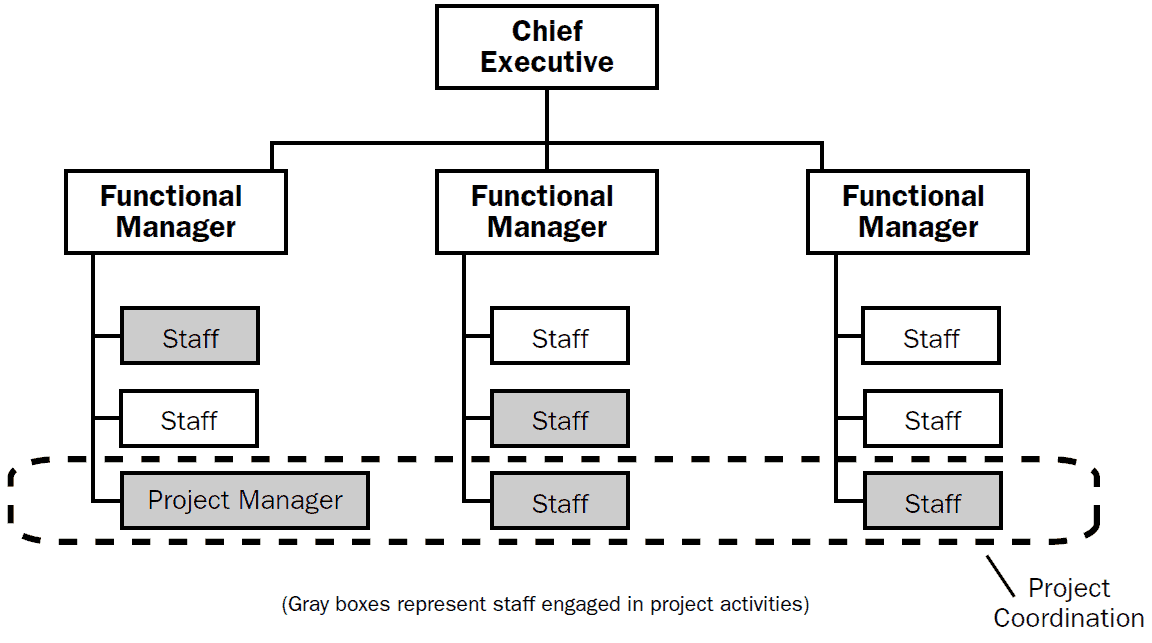
Figure 10 – Matrix Organization Structure
This Matrix model is effectively a hybrid of the two previous models, and the term “Matrix” results from the ‘vertical’ and ‘horizontal’ teams that exist at any given time within the organization. Generally PM’s are ‘assigned’ from within a vertical function and are tasked to ‘build’ a team from resources across all of the functions; resources generally get allocated for 100% of their time for the period required. With this approach, once resources are no longer needed on a specific project, they return to their functional ‘home’ to resume functional-based tasking or be reallocated to another project. These structures get referred to as ‘weak’ or ‘strong’ matrix depending on whether they are more functional or project-based respectively. As an organization trends toward a strong matrix hierarchy they can actually create further vertical ‘cells’ that are purely project focused (see Figure 11). This is in essence a Project Management “Function”, and although run as a more project-based structure, it can suffer the same siloed mentalities observed in fully function based hierarchies.
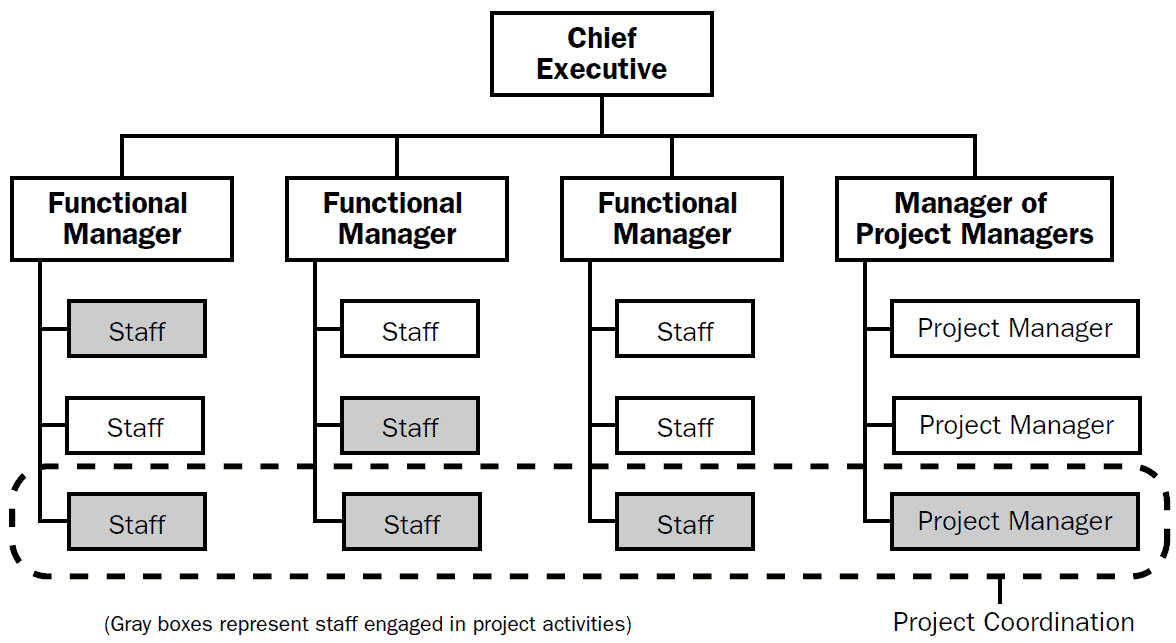
Figure 11 – ‘Strong’ Matrix Organization Structure
In a Matrix structure, the conditioned thinking can occur in any variant of the previous models and at any time and can be a combination of engrained functional process within silos and the individual lead approaches from prior contracts or prior companies. The unproductive tension is equally as variable, and can be as simple as the assignment of a technical lead with a PM who does not agree with the other’s approach and carries ‘history’ from previous projects.
The three organizational structures highlighted above can be allocated as follows to the specific cases noted in this paper:
- Generic Rolling Stock structure (Figure 3) – Functional hierarchy
- AWD build program (Figure 4) – Matrix (favoring IPTs)
- Boeing 737 MAX re-engined upgrade (Figure 7) – Strong Matrix
Therefore, the type of organizational hierarchy does not provide an immediate solution to managing conditioned thinking nor the resulting unproductive tension, and every structure has its pros and cons for both efficient and effective delivery of projects. The challenge actually lies in the allocation of “accountability” and this, in itself, has another representation of conditioned thinking. CEO’s and equivalent executive decision makers in modern organizations have at some point undergone “leadership” training and a large number will have completed MBAs. This training, like that of a PM and an Engineering Manager, is established against ‘recognized’ standards and tends to be focused on financial management of the organization. There has been a significant focus applied to business growth particularly in terms of returned profit and year-on-year increased sales. And unfortunately this tends to ‘flow-down’ through the organization in the form of personnel goals and objectives and gets placed on the PM allocated to deliver the assigned projects. When looking at any organization, it can be quite difficult to determine who has the accountability once you go beyond the Program Manager (or Functional Manager in a functional structure). More so, the difficulty of separating the executive authority from the technical authority is quite often impossible. A large number of project delivery organizations appoint Chief Engineers who are believed to hold the technical authority for any assigned project or products; however, when looking at role responsibility, the position is an auditing role confirming that all business processes were followed and based on the data available the system is fit, form and function, and safe to operate. In reality all of the decisions are being made by the ‘accountable’ PM to ensure that the project achieves its milestones and release the related payments
Recently Elon Musk was interviewed during the Wall Street Journal (WSJ) CEO Summit where he highlighted that CEO’s are not focused on the right things to achieve the growth to which they are aspiring. He noted that “A company has no value in and of itself. It only has value to the degree that it is an effective allocator of resources to create goods and services that are of a greater value than the cost of the inputs.” Relative to the concepts described in this paper, he is indicating that the organization structure is important as it is the way the organization allocates its resources to create the products.
When looking at the 737 MAX program structure within Boeing, the issues encountered all have pointers back to how Boeing had restructured into a Strong Matrix hierarchy. The members of the executive board of Boeing were focused on returns to shareholders, and restructured to place accountability for project delivery with the program leads. The decision to proceed with the 737 MAX was against technical guidance but was forecast as only 10% of the cost of designing a new product. The technical decisions were overtaken or even over-ridden by the program leads and the technical heads of the various functional areas had no direct control over the technical resources. The organization promoted leadership attributes and retained the members of executive roles even though most programs were failing to deliver and some were considerably behind schedule with products being delivered with poor quality. So “Accountability” was so dispersed that it was seen and internally advertised as ‘shared accountability’ potentially to create a buffer between the transactional and executive level of the organization.
Finally, once the organizational hierarchy is established and roles assigned, the next challenge is role responsibility. Each role will have some form of Position Description (PD) associated with it that permits recruitment but also serves as a means for individuals to understand their authority and responsibility within the project or even the organization. These tend to be quite generic in nature and rarely get tailored for a particular role within any allocated project, especially for functional constructs where they are more definitions of experience level. For most industry sectors, the customers request a clearer definition of project roles within the operating plans, and regularly these would conflict with an individual’s PD, leading to further unproductive tension. The current initiatives associated with improving the integration of program management and systems engineering are making an attempt to more clearly differentiate responsibility between roles within a program. The work within INCOSE UK associated with creating guides for the application of systems engineering has developed a specific view of how program management and systems engineering can ‘work together’ during each phase of the delivery lifecycle (refer to Guide Z11 Issue 1.1, Jan 2018). This is a great step toward reducing some unproductive tension between these practitioners without disrupting their current conditioned thinking but it doesn’t actually promote the ‘true integration’ of the associated processes and this will always be complicated by the organization’s role definitions and expectations.
Overcoming ‘Unproductive Tension’
This paper has described the issues identified in my 2018 paper associated with why it is so difficult to integrate project management and systems engineering within programs. The singular recurring theme explored is that of ‘conditioned thinking’ which generally leads to ‘constrained thinking’ and inevitably ‘unproductive tension’ between the delivery-agents of an organization. The content provided is intended to aid the reader in identifying where this ‘conditioning’ might surface and highlight why this inevitably causes projects to ‘derail’ and fail to achieve their original objectives. The remaining question is ‘what can be done to reduce or eliminate the resulting unproductive tension’?
Unfortunately, there is no easy answer to this as we are all human and we work within the constraints that this brings. As humans we become passionately attached or even committed to our learned beliefs and our first reaction is always to reject what does not fit with what we believe to be “real”. So when one’s delivery organization consists of several different disciplines all with different perspectives of what is ‘real’ but all being driven to ‘comply’ with their own related standards, then it is no wonder that activities become disconnected and the tension begins to rise.
Each project within the organization “must” adhere to each of these business processes and so you have a set of Project Management processes, a set of Systems Engineering processes, and a set of Asset Management processes all running in parallel (but not quite in sync); and having Quality Management, Finance, Supply Chain, and a raft of other business ‘functions’ layering their processes in addition and demanding that their hurdles receive the same amount of attention or they won’t ‘service’ your requests. And then somewhere amongst that quagmire of evolved process someone says “the product is non-compliant” and the customer says “we will not accept it until compliance can be ‘assured’”.
And so you stop, and you scratch your head, and you wonder ‘what were we meant to be building?’ One understandably feels the pressure that it doesn’t matter, so long as we are compliant to the processes and we provide required deliverables at the payment milestones. It should not be a surprise then that when one gets to testing of the final integrated system, numerous interdependencies have been overlooked and you ‘experience some delays as issues are identified during testing’.
One area of Project delivery that can assist with overcoming these issues is during Plan development. Rather than the usual approach of each discipline lead heading off in a silo to develop their ‘own plans’ in compliance with their ‘mandated processes’, you could suggest a workshop where the Capability is decomposed into all of its constituent parts and each responsible manager discusses how those parts will be achieved. And then write the Plans ‘together’, with a common, unified set of processes; and restructure your organization (or at least your Project) so that the higher risk areas have individuals assigned with clear accountability for delivery and direct communication with interdependent aspects of the program.
Further to developing Plans that can actually be used to manage the project’s objectives, the following are some topics that can be addressed to assist with overcoming our conditioning:
- Accountability requires ‘authority’ to make decisions and full control of allocated budgets including all risk contingency related to the scope. It also needs direct engagement with any stakeholders (internal or external) who have influence or dependence on the task inputs and/or outputs. This includes all resources allocated to the associated Work Packages. The concept of ‘shared accountability’ has evolved in relatively recent times due to a combination of organization structures and ‘leadership’ training and should be avoided since the result is a lack of accountability. Delegation of accountability is another misnomer and is confusion of delegation of responsibility (or delegation of Authority).
- Schedules should reflect the content of your Plans and be based on ‘actual’ work to be done. Having schedules based on Full-Time-Equivalent (FTE) ‘by-the-name’ resourcing is absolutely useless. This includes all ‘overhead’ roles within a project, especially the Project Management Office, because if they are scheduled as FTE then they are wasting money (you just don’t know how much). ‘By-the-name’ resourcing should not be practiced because it results in FTE based schedules.
- A common, unified set of processes for any tasks identified as necessary to yield the final capability is essential. Avoid having discreet discipline-based processes, and if any process exists that is not applicable to all team members, then it likely is not required or, at least, it should be reviewed for relevance in delivering the actual outcome. An example is PM meetings and systems engineering reviews – these are in reality project maturity gates, where all active and upcoming tasks are assessed for completeness and residual risk (technical and programmatic). Also, there should be no separate functional ‘support’ processes; rather, these need to be integrated into the project processes (including recruitment and staff management, finance, supply chain, procurement, quality control, etc.).
- Finally, with regard to the significant concepts raised in this paper, the project role structure needs to align with the work to be completed. This is one of the most difficult challenges to overcome; however, taking steps toward a more effective delivery structure should help to reveal some of those long-held beliefs and allow bolder changes on future projects. When workshopping the Capability decomposition, avoid thinking in terms of disciplines required; rather, apply an approach similar to the Product Breakdown Structure (PBS); Work Breakdown Structure (WBS), and Organizational Breakdown Structure (OBS) sequence that is described in most delivery-focused standards. Every Product or Capability requires a sequential buildup of elements into sub-systems, which are then integrated together to form functional systems, and finally into a Capability. The majority of Capabilities can be planned as iterative releases until a final Capability is achieved. At every stage of this development, integration, implementation, and release ‘cycle’ the organizational structure should be ‘designed’ to complete the work. For example, consider having a test team that has members of the requirements team and vice-versa, so that requirements get developed that are testable and the interpretation is available within the test team. Consider extending that thinking to the high-risk areas of the project by creating a structure where the logical set of work packages has appropriate resource types (and expertise) assigned, and the resulting Cost Account (CA) is allocated to an ‘accountable’ lead. If the dominant risk is technical, then that lead should be technical; and if it’s programmatic, then a PM and so on.
It’s my hope that you are now thinking more broadly about the application of skills and knowledge on any given work package. Also, that ‘true integration’ is the collaborative engagement of all disciplines to achieve the desired outcome. Referring back to the approach adopted by INCOSE UK utilizing the Z-Guides, it should be clearer that this is a “reaction” to the decades of conditioned thinking, whereby the disciplines “carve-out” their piece of the projects work package. This may allow some division of role responsibility, but it will never eliminate the ‘unproductive tension’, because, as an example, the PM will not ‘understand’ the Configuration Management needs of a program because they see it as an SE responsibility. Also, the SE would generally say the PM hasn’t provided a suitable schedule to achieve the technical output. A more integrated approach would have every discipline contributing to the Risk Management, Configuration Management, make/buy decisions, schedule management, etc., and the “accountable lead” for the Cost Account is responsible for authorizing the approach taken and de-confliction of the multiple perspectives.
Conclusions and Recommendations
For the six specific aspects noted in the introduction to this article, following is a summary view of what needs to occur in order to affect true integration of program management and systems engineering.
- Human Nature – we are all human so accept it and approach every project or delivery program with the understanding that all involved (including Customers and Regulators) have been ‘conditioned’ and are not ‘thinking clearly’ and will resort to learned beliefs and cultural norms. Subtlety is critical as ‘people’ will instantly reject any suggestion that deviates from the norm. 2021 is a year that delivers one of the ‘key levers’ to affect change within a currently PM centric delivery program model and this is through the release of the new PMBOK 7th Edition. This new release has been directly influenced by the PMI-INCOSE-MIT collaborative research work and involves a significant deviation away from descriptive process and deliverables focus; it is Principles-based and outcome-focused. Steps need to be taken to help the PM community understand the critical importance of strengthening PM and SE integration.
- Communication – During contract planning and throughout delivery, avoid using discipline specific language and use generic language related to the actual status of your contract and program. It is not a CDR nor a Critical Design Review – it is a Project Maturity Gate (PMG); its purpose may be contractually different from one project to the next. The intent of this PMG is to assess whether the design is mature enough to proceed to the next stage. Providing all contract deliverables is not sufficient. We need to provide expectations based upon the actual status of the project or program.
- Culture & Environment – The purpose of having standards and process is to facilitate the efficiency and effectiveness of project or program delivery. The standards and processes need to be assessed for applicability and suitability. If a Customer infers the necessity for compliance to any particular standard or process, that inference should be verified for validity for the specific project or program. It is quite likely that some aspects of any standard or process are not applicable or appropriate for a particular project or program. Safety and Integrity can only be ‘assured’ when the foundations are ‘verified’. Designing to a Standard does not in itself ‘assure’ anything. If your program is independently monitored by Regulators then it is even more important to ensure that the applicability of standards or process is confirmed.
- Societal – standardization is a current societal ‘habit’ and for the most part it does make life easier for subsequent activities or endeavors; however, more often than not, it builds in complexity. These days, contracts are ‘template-based’ and the referred standards are a part of an ‘industry library of standards’. So now more than ever it is critical to understand what the ultimate objective is and to develop your plans and procedures to deliver that objective. Many industries are realizing this dilemma and revisiting their contracting models in an effort to adopt more collaborative contracting arrangements – those involved need to overcome their own internal conditioning. If one focuses on Capability and outcomes, then the red-herrings in contracts can be identified and resolved more effectively.
- Organizational – companies, especially large ones, need to adopt a hierarchical construct of some form in order for effective decision making to occur and allow dissemination of those decisions to filter through to all employees. Do not fall foul of the resulting biases that those constructs embody. Particularly important is to see beyond the management rhetoric that has emerged with current business practices. Business psychology has become an industry unto its own with leadership programs and employee engagement surveys proliferating most organizations. It is important to realize that these activities are intended to provide a level of engagement that promotes employee accountability within organizational structures. If your organization or project has a traditional Line managed hierarchy, then any accountability is likely ‘shared accountability’ which in reality means that ‘no one is actually accountable’. We must provide project structures that are directly aligned to what needs to be delivered.
Recall that the content from Chapter 16 of Integrating Program Management and Systems Engineering (IPMSE) provided calls to action for several groups of stakeholders: academia, enterprise, policymakers, industry and professional societies, and researchers. These calls to action identify specific actions that stakeholders in each group should take. We are now seeing some positive outcomes from PMI with the impending release of the 7th edition of the PMBOK, but this has yet to be mirrored within the INCOSE publications. Also, there are many positive signs from Academia (particularly within Australia), but this has not yet materialized in any practical change.
The other groups that were called out in the previous paper from Issue 72 of PPI SyEN were CEOs and the general discipline practitioners. For CEOs we are seeing industry disrupters like Elon Musk highlighting the modern trends of financials over product – hopefully this resonates with many business leaders. The critical step that these change agents should take is to understand that their employees are operating largely on auto-pilot with similar training conditioning their thinking and actions. Fostering a culture where the outcome and realization of desired Capability is more important than forcing deliverables at milestones or exiting review gates to achieve an early payment milestone would be a tremendous step forward.
Finally for practitioners, we must discipline ourselves to not blindly follow a process and not assume that compliance and assurance is achieved through adherence to standards and processes. Understandably, this requires improved practice of both systems engineering and program management. We must understand the work that is needed to achieve the desired outcome, and develop or tailor standards and processes specifically to deliver that work. Recognize that other practitioners have also been conditioned to their own learned beliefs and that being confrontational to promote your personal conditioning will only add to the unproductive tension. Take the time and effort to adjust your language to describe why an event is occurring within the context of the outcome desired.
Obviously the change required to overcome our conditioning and to fully integrate systems engineering and program management will be difficult. As I have described, the needed change will require program managers and chief systems engineers leading complex programs to work differently. Our responsibility to everyone involved demands that we commit ourselves to necessary continuous improvement of our approach. I trust that the observations and suggestions provided in this paper will facilitate the needed journey.
References
Griffin, Martin. “Integrating Program Management and Systems Engineering”, Project Performance International Systems Engineering Newsletter (PPI SyEn) Issue 72, December 2018. Available here.
Hiatt, James. ADKAR: A Model for Change in Business, Government, and Our Community. Prosci Learning Center Publications, 2006.Joint Authorities Technical Review (JATR) – Boeing 737 MAX Flight Control System – Observations, Findings, and Recommendations, October 11, 2019
INCOSE UK Z-Guides available here.
Rebentisch, Eric. Integrating Program Management and Systems Engineering. Hoboken, New Jersey USA: John Wiley & Sons, Inc., 2017. Available here.
Roseke, Bernie. “The 4 Types of Project Organizational Structure”, August 16, 2019. Available here.
Steward, David (Parsons Brinckerhoff). INCOSE UK Rail Interest Group, January 21, 2009.
The Auditor General, Audit Report No.22 2013–14, Air Warfare Destroyer Program, 6th March 2014.
The Wall Street Journal. CEO Summit interview with Elon Musk, December 8, 2020. Available here.
Young, Ralph R. Article series addressing program managers and chief systems engineers integration. Victoria, Australia: Project Performance International Systems Engineering Newsletter (PPI SyEN) Issues 56 – 73, August 2017 through January 2019. Available here.
About the Author
 Martin Griffin has over 25 years’ experience in engineering design and management, with 10 years specifically within the Maritime Defense sector and currently involved in agile software development. He has eight years’ experience as an Executive Engineering Manager and is a discipline specialist in Systems Integration Engineering, Maritime and Mechanical Engineering, RAM Analysis, Safety Cases, and Risk and Issue Management. Martin is experienced in the successful delivery of complex engineering systems and services within Technical Regulatory Frameworks in the defense sector.
Martin has worked in project management capacities as well as engineering management and has led organizational change initiatives to maximize the effectiveness of delivery. Through the 2009 Defense Strategic Reform Program, he molded a functionally based engineering group into a LEAN project delivery team operating across individually tailored Systems Engineering upgrades, to halve the cost base of the organization. More recently, he led the restructuring of engineering disciplines into multi-domain delivery cells that are able to operate across multiple support contracts utilizing unique system engineering process models.
1See www.sesa.org.au ↑
2Martin Griffin, “Integrating Program Management and Systems Engineering”, Project Performance International Systems Engineering Newsletter (PPI SyEn) Issue 72, December 2018. Available here. ↑
3PRINCE2, or PRojects In Controlled Environments, is a popular project management methodology used in over 150 countries. It’s a process-based approach that focuses on organization and control throughout the entire project, from start to finish (Wikipedia). ↑
4The PMI-INCOSE-MIT collaboration was one of several actions taken in response to the research finding that unproductive tension exists between PMs and SEs. See Rebentisch [ ], p. xiviii for a discussion of the origins of this collaboration. ↑
5See “What is the ADKAR Model” for a description of this goal-oriented change management model that guides individual and organizational change – available here. ↑
2.2 A Practical Example of the Process to Define a System Functional Architecture
by
Alfonso Garcia and Jose L. Fernandez
Emails: alfgarciacasado@gmail.com, joselfernandez@telefonica.net
Independent Consultants
January 9, 2021
Abstract
One of the most important activities that system engineers must perform is to understand what the system must do to deliver the expected value to its stakeholders. Doing so by creating the system functional architecture has numerous benefits that facilitates the subsequent phases of the system development. In this paper, we demonstrate how to apply the ISE&PPOOA MBSE methodology to create a consistent functional architecture of an Electric Park Brake System using Cameo System Modeler™ with its SysML profile, taking advantage of the simulation capabilities of the tool.
Web site: http://www.omgwiki.org/MBSE/doku.php?id=mbse:ppooa
Copyright © 2021 by A. Garcia and J.L. Fernandez. All rights reserved.
Introduction
The functional architecture of a system represents the decomposition of its functions and the interactions between these functions representing flows of behavior. It is the result of the functional analysis and it is at the core of the system architecture modelling activities [1], as the functional architecture represents the main definition of the problem, i.e. “what the system does that delivers value”.
One of the main advantages of defining the functional architecture is that it is independent of the technical solution at the highest levels of its hierarchy. That helps us avoid constraining the design solution space too soon during the early stages of the development, and it also helps minimize impact of changes during the design stage as the physical solution evolves as technology is applied to the system.
The functional architecture is depicted by diverse diagrams supporting the different views applied to the functional architecture model. The main views of the functional architecture are those describing the functional hierarchy, the functional interfaces, and the functional flows.
In this article we show how to apply the ISE&PPOOA MBSE methodology [2] to define the functional architecture of an Electric Park Brake System (EPBS) using the Cameo Systems Modeler tool out of the box, without adding any other profile but the standard SysML.
Essentially, an EPBS has the same responsibility like a traditional mechanical handbrake: to hold the car firm in place once it is parked. However, when the driver uses a mechanical handbrake, she must control the retaining force to be produced by the handbrake with the only help of her senses and intuition. Conversely, adding electronic control provides numerous benefits to the driver that facilitates her driving experience, comfort, and increases safety.
When the car is stationary and the EPBS is activated, this system calculates the needed retention force based on the slope inclination, and it will re-adjust the produced force to keep the car in place, as the temperature changes or as the brake pads wear along their lifecycle. Additionally, the system assists the driver when starting on a ramp, preventing the car to roll back. In case the driver leaves without parking the vehicle, the system detects it and immediately immobilizes the vehicle. Conversely, the EPBS cannot be released if the engine is on and the driver’s seatbelt is not buckled (i.e. child safety lock). Finally, this system provides emergency brake function to stop the vehicle when in motion and commanded by the driver.
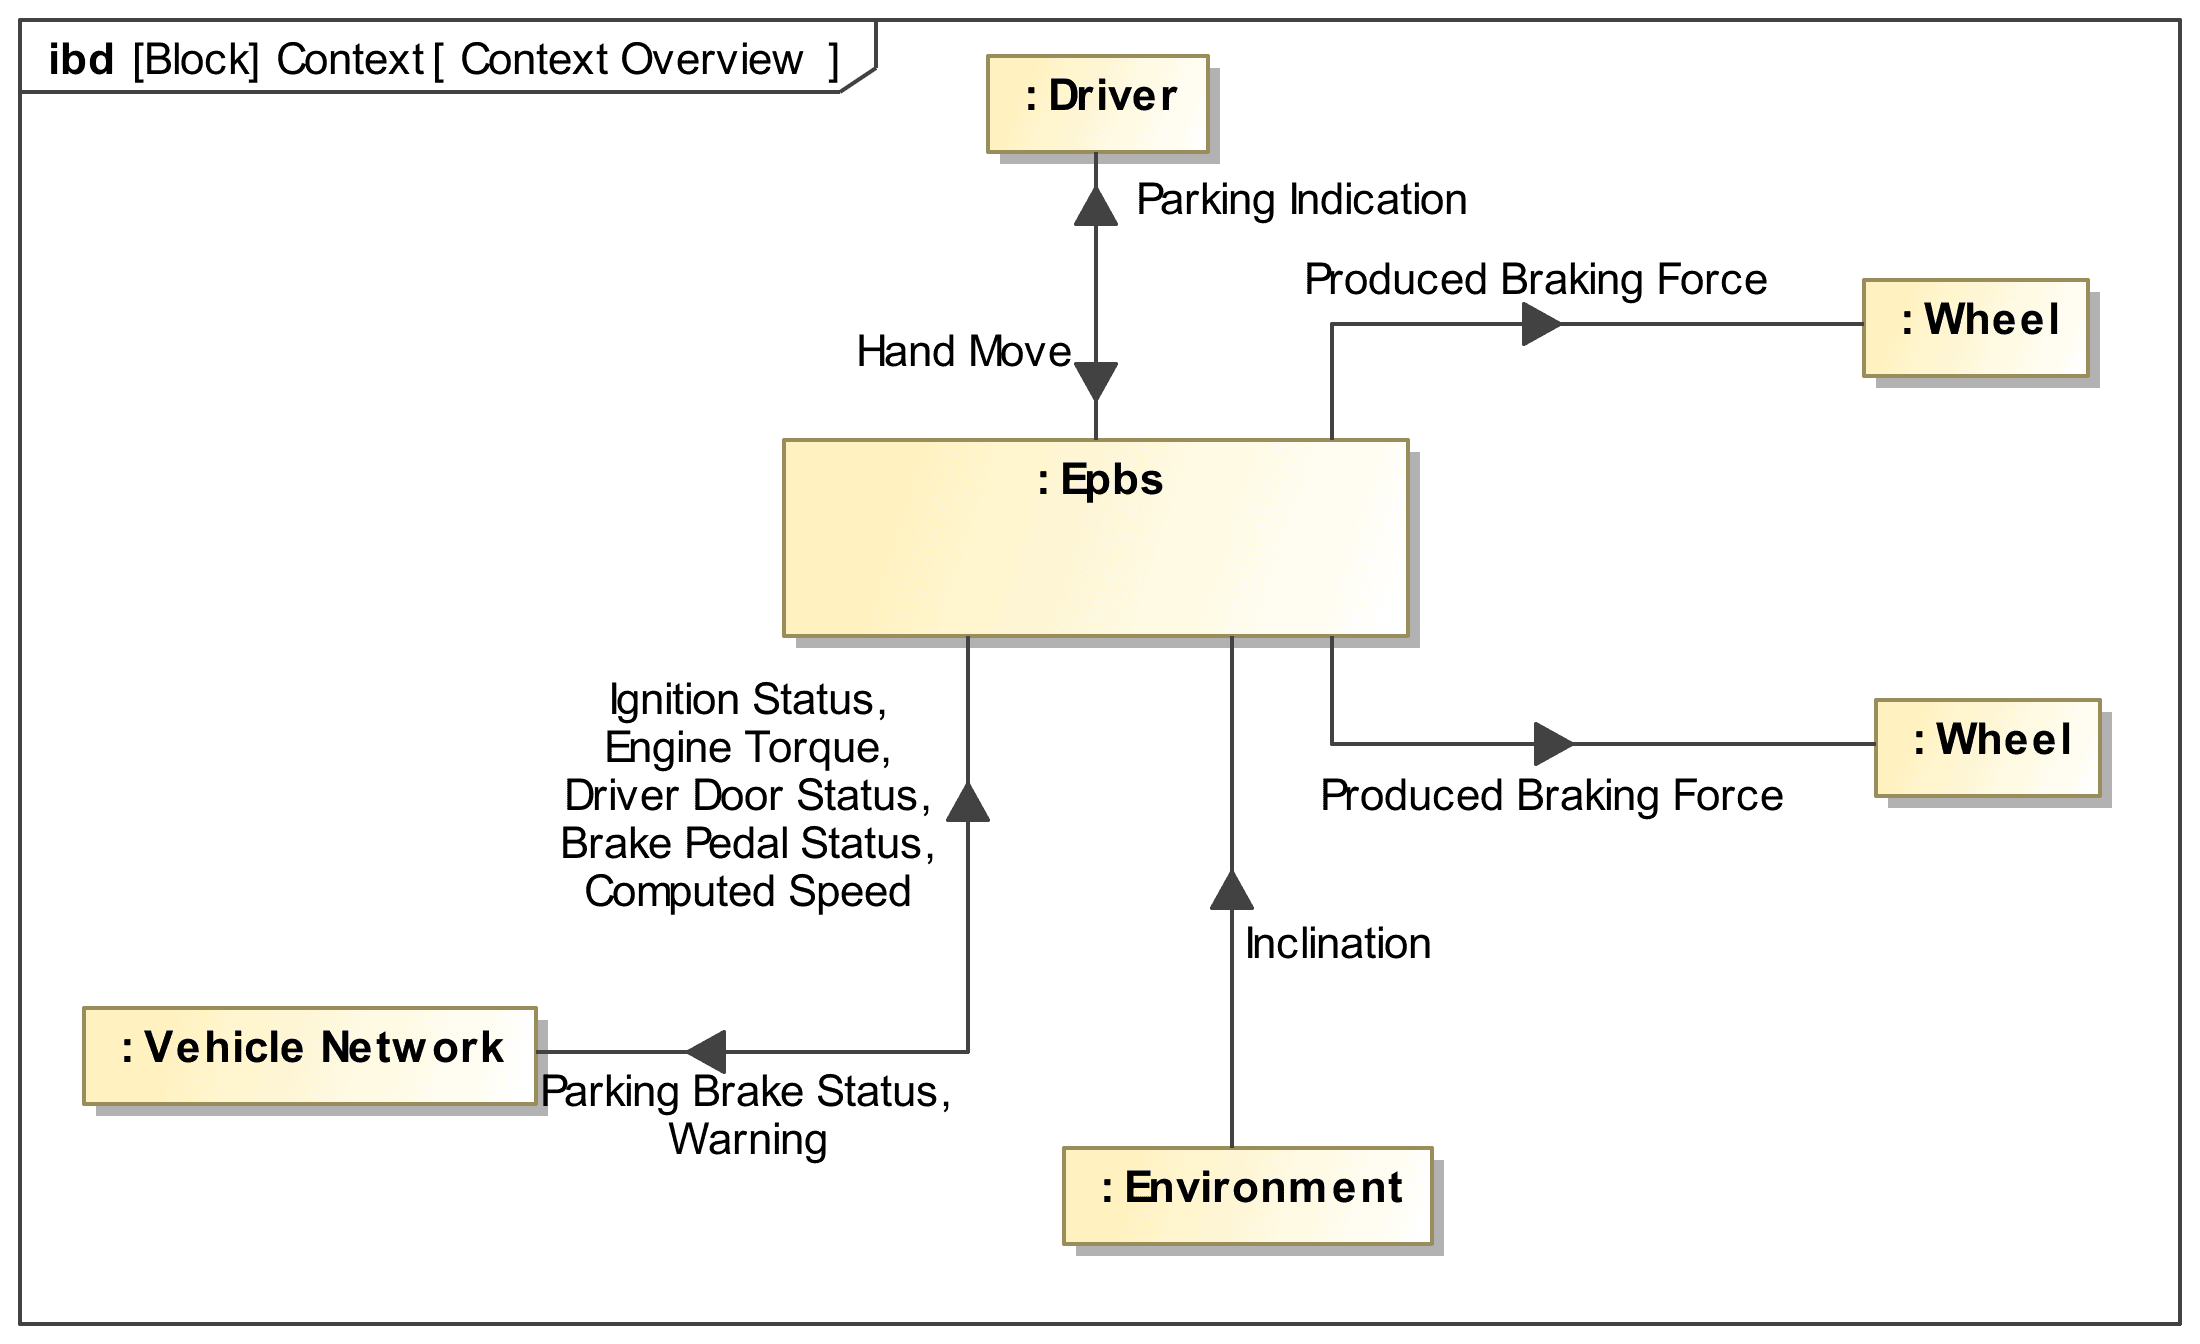
Figure 12. Context Diagram of the Electric Park Brake (EPB) system.
The main benefit of the methodology + tool approach presented here is that the main functional flows are seamlessly obtained from the functional interfaces represented schematically by N² charts for the functions identified and represented by SysML BDD hierarchies.
The Process
ISE&PPOOA is a requirements-driven system engineering methodology that integrates model-based systems and software engineering approaches for the development of complex products. The ISE&PPOOA methodological process can be envisioned as the assembly of the three dimensions: mission, system, and software. Each dimension has associated project deliverables, mainly models but complemented with textual and tabular representations [2].
The mission and systems engineering dimensions of the ISE&PPOOA process are described briefly here. The mission dimension represents the system context, system scenarios, operational needs and capabilities related to the mission. An important result, besides requirements, of the systems engineering dimension of the ISE&PPOOA methodological process is the creation of the functional and physical architectures outcomes, identifying the constituent subsystems and their interfaces. The system may have subsystems that are software intensive and/or non-software intensive where physics conservation laws of mass, energy, and momentum are an important issue that should be considered when representing the system views.
The methodological process presented in Figure 13 has four groups of steps that are performed sequentially for groups 1, 2, 3, and 4. Step 2 is split into two parallel or concurrent steps. Step groups 3 and 4 are executed iteratively [2].
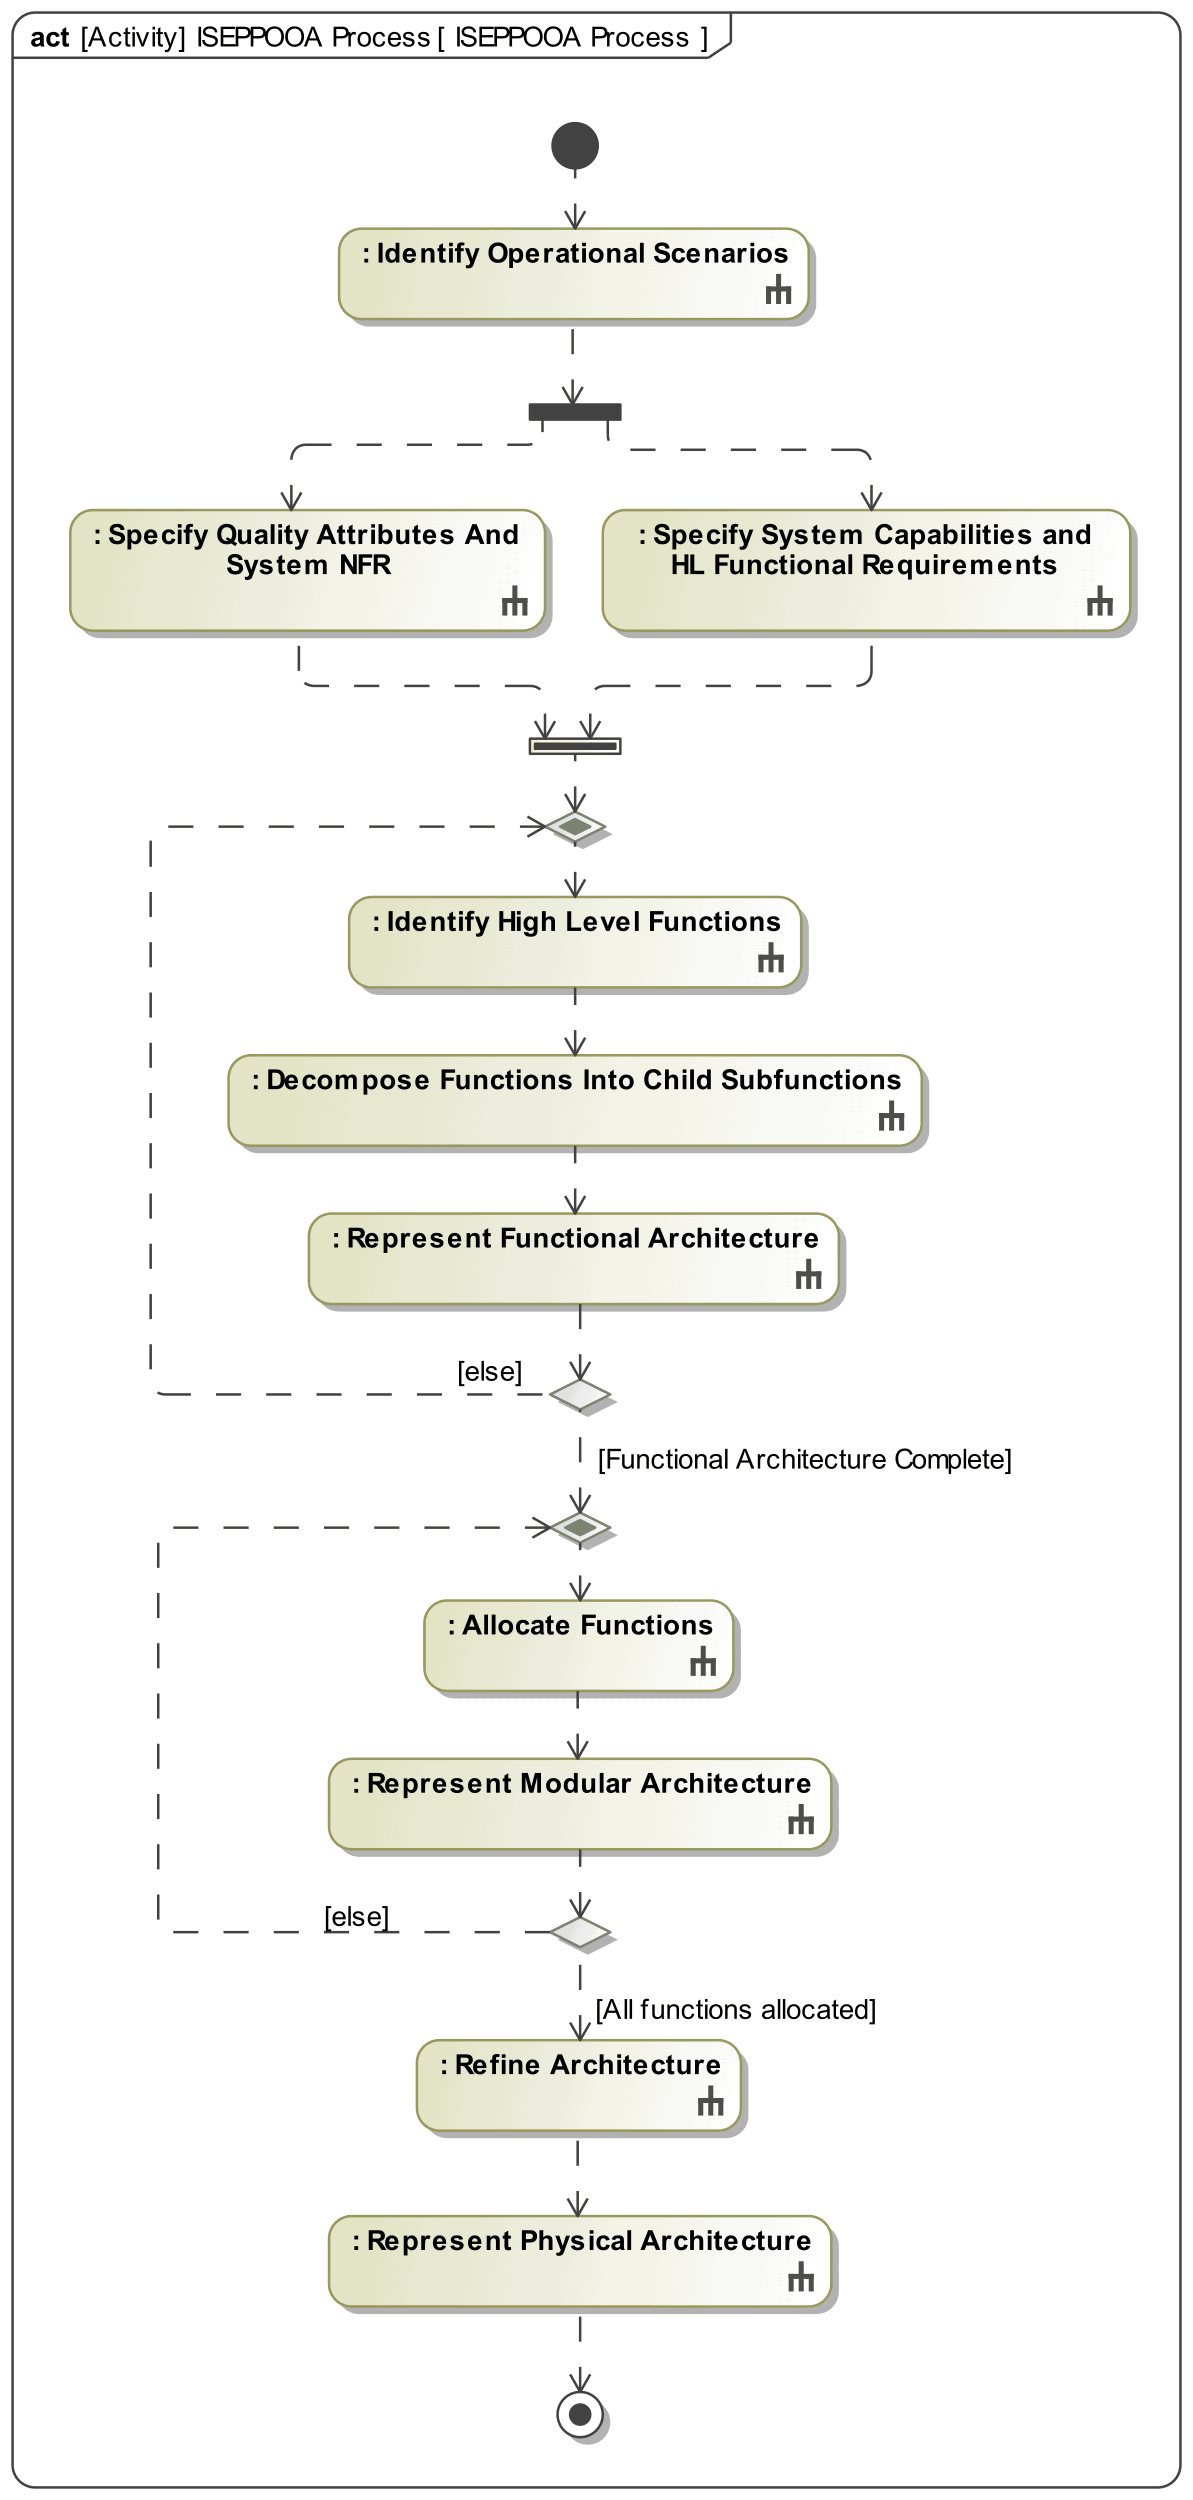
Figure 13. Overview of the ISE&PPOOA Process
Create the Functional Architecture
Once operational scenarios, capabilities, quality attributes and high-level requirements (functional and non-functional) have been identified, the next step is to build the functional architecture. The process, shown in Figure 13, is an iterative process where:
- the functional hierarchy is defined using SysML block definition diagrams (BDD),
- the main functional interfaces are identified and represented by N² charts [3], where matter, energy or information items that are moved between functional pairs are shown,
- the main functional flows are identified and represented by SysML activity diagrams [4] using the previously defined functional hierarchy and interfaces as inputs.
As a result, we will have the representation of all needed functions to satisfy the system requirements, the dependencies between these functions and how they must interact to provide the required behavior.
Define the Functional Hierarchy
The functional hierarchy is a representation of the decomposition of the top-level function/s of the system into their children to a level of detail that allows us to identify elements of form that will be responsible to provide the allocated functions, all inputs to the system are transformed into outputs, and all operational scenarios are covered.
A function is considered in ISE&PPOOA as a transformation of input flows into output flows (or their state), according to the action implied in its name. These input/output flows can be material, energy, or data. For example, a motor converts (transformation) electric energy (input) into rotational energy (output), an elevator transports (transformation) persons (both input and output flow) vertically from one floor to another within a building, or a brake pedal converts feet force (input flow) into brake demand signal (output flow).
The usual naming convention for a function emphasizes the transformation and the outcome that deliver value in the form of “action verb + object” [5] or “process + operand” [6]. That is consistent with the definition of function proposed by INCOSE [7]: “a characteristic task, action, or activity that must be performed to achieve a desired outcome.”
To define the functional hierarchy, it is highly recommended to use both top-down and bottom-up approaches. It must be highlighted that the identification of these top-level functions and their decomposition is not a trivial task at all. On the contrary, it requires a great deal of domain knowledge and abstract thinking. Thus, the systems engineer must request support from other engineers and stakeholders to validate, identify gaps and inconsistencies and help propose new or alternative functionality.
Top-down Approach
When using the top-down approach, we use the system capabilities and high-level functional requirements, defined in the previous steps of the methodological process, to identify high-level functions.
A capability (Figure 14) is defined in ISE&PPOOA [2] in the same way as proposed by DoDAF [7]: “a capability is the ability to perform an effect under specified standards and conditions through combinations of means and ways to perform a set of tasks.” Similarly, Charles S. Wasson states in his book [8] that a system capability “represents a physical potential -strength, capacity, endurance- to perform an outcome-based action for a given duration under a specified set of operating environment conditions,” and it “is realized when the system performs its planned action(s) in its prescribed operating environment as intended by its developers.”
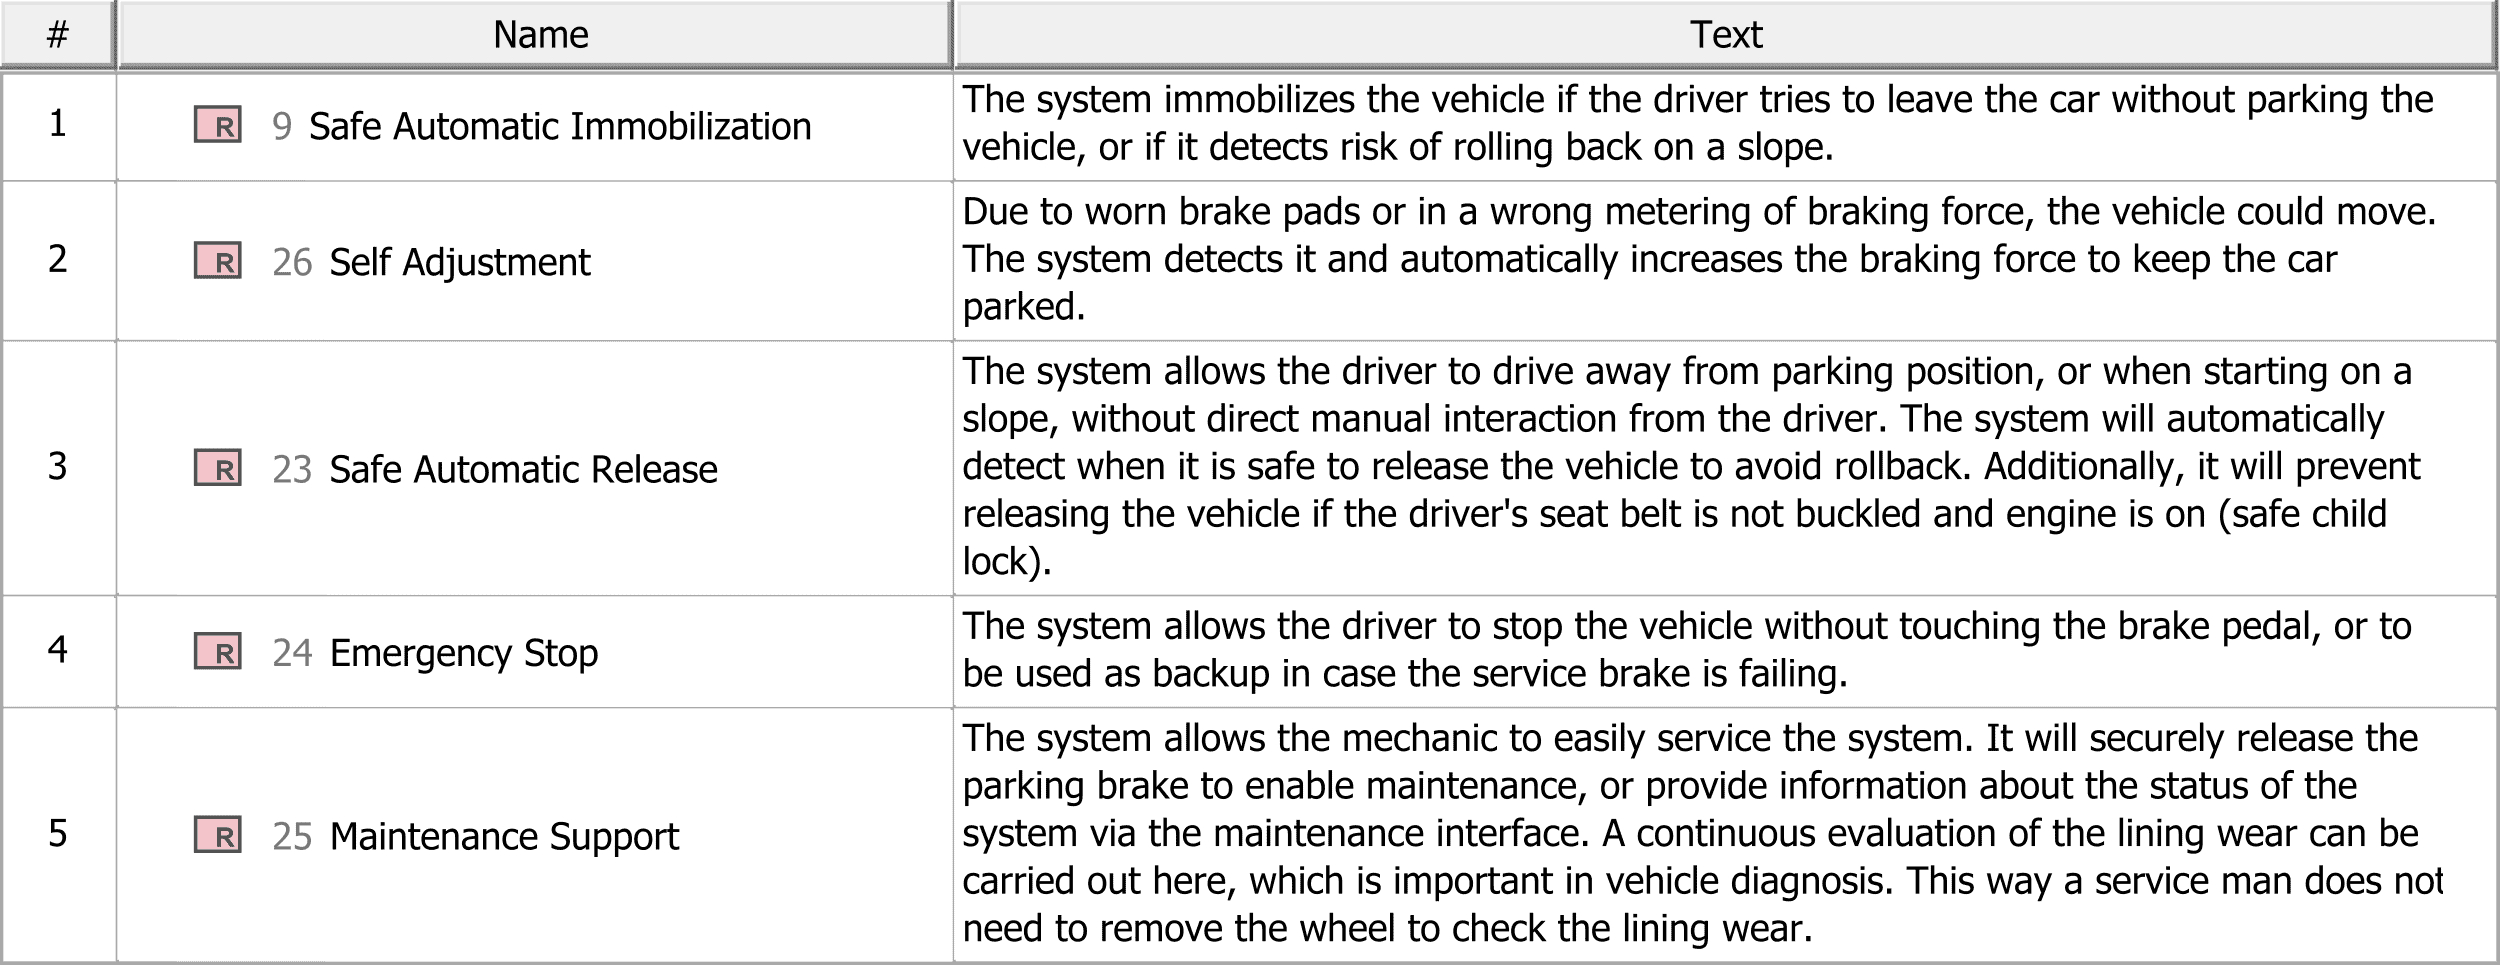
Figure 14. Example of system capabilities for the EPBS
Additionally, the identified functions must be consistent with the system context, i.e. each system input received by the system and each output produced by the system to deliver value must be received and produced by one of its functions (or a sequence of functions) identified from the capabilities [2].
A best practice is to take advantage of functional taxonomies that were already defined in similar domains of application to that of the system under development, e.g. the INCOSE taxonomy of functions for a commercial aircraft [9], or the NIST taxonomy of functions for industrial processes [10].
In the same way, we could use templates and patterns, such as the template defined by Hatley and Pirbhai for real-time control systems [5] or the typical closed-loop control pattern, as it is proposed by Buede [11] and shown in Figure 15 and Figure 16.
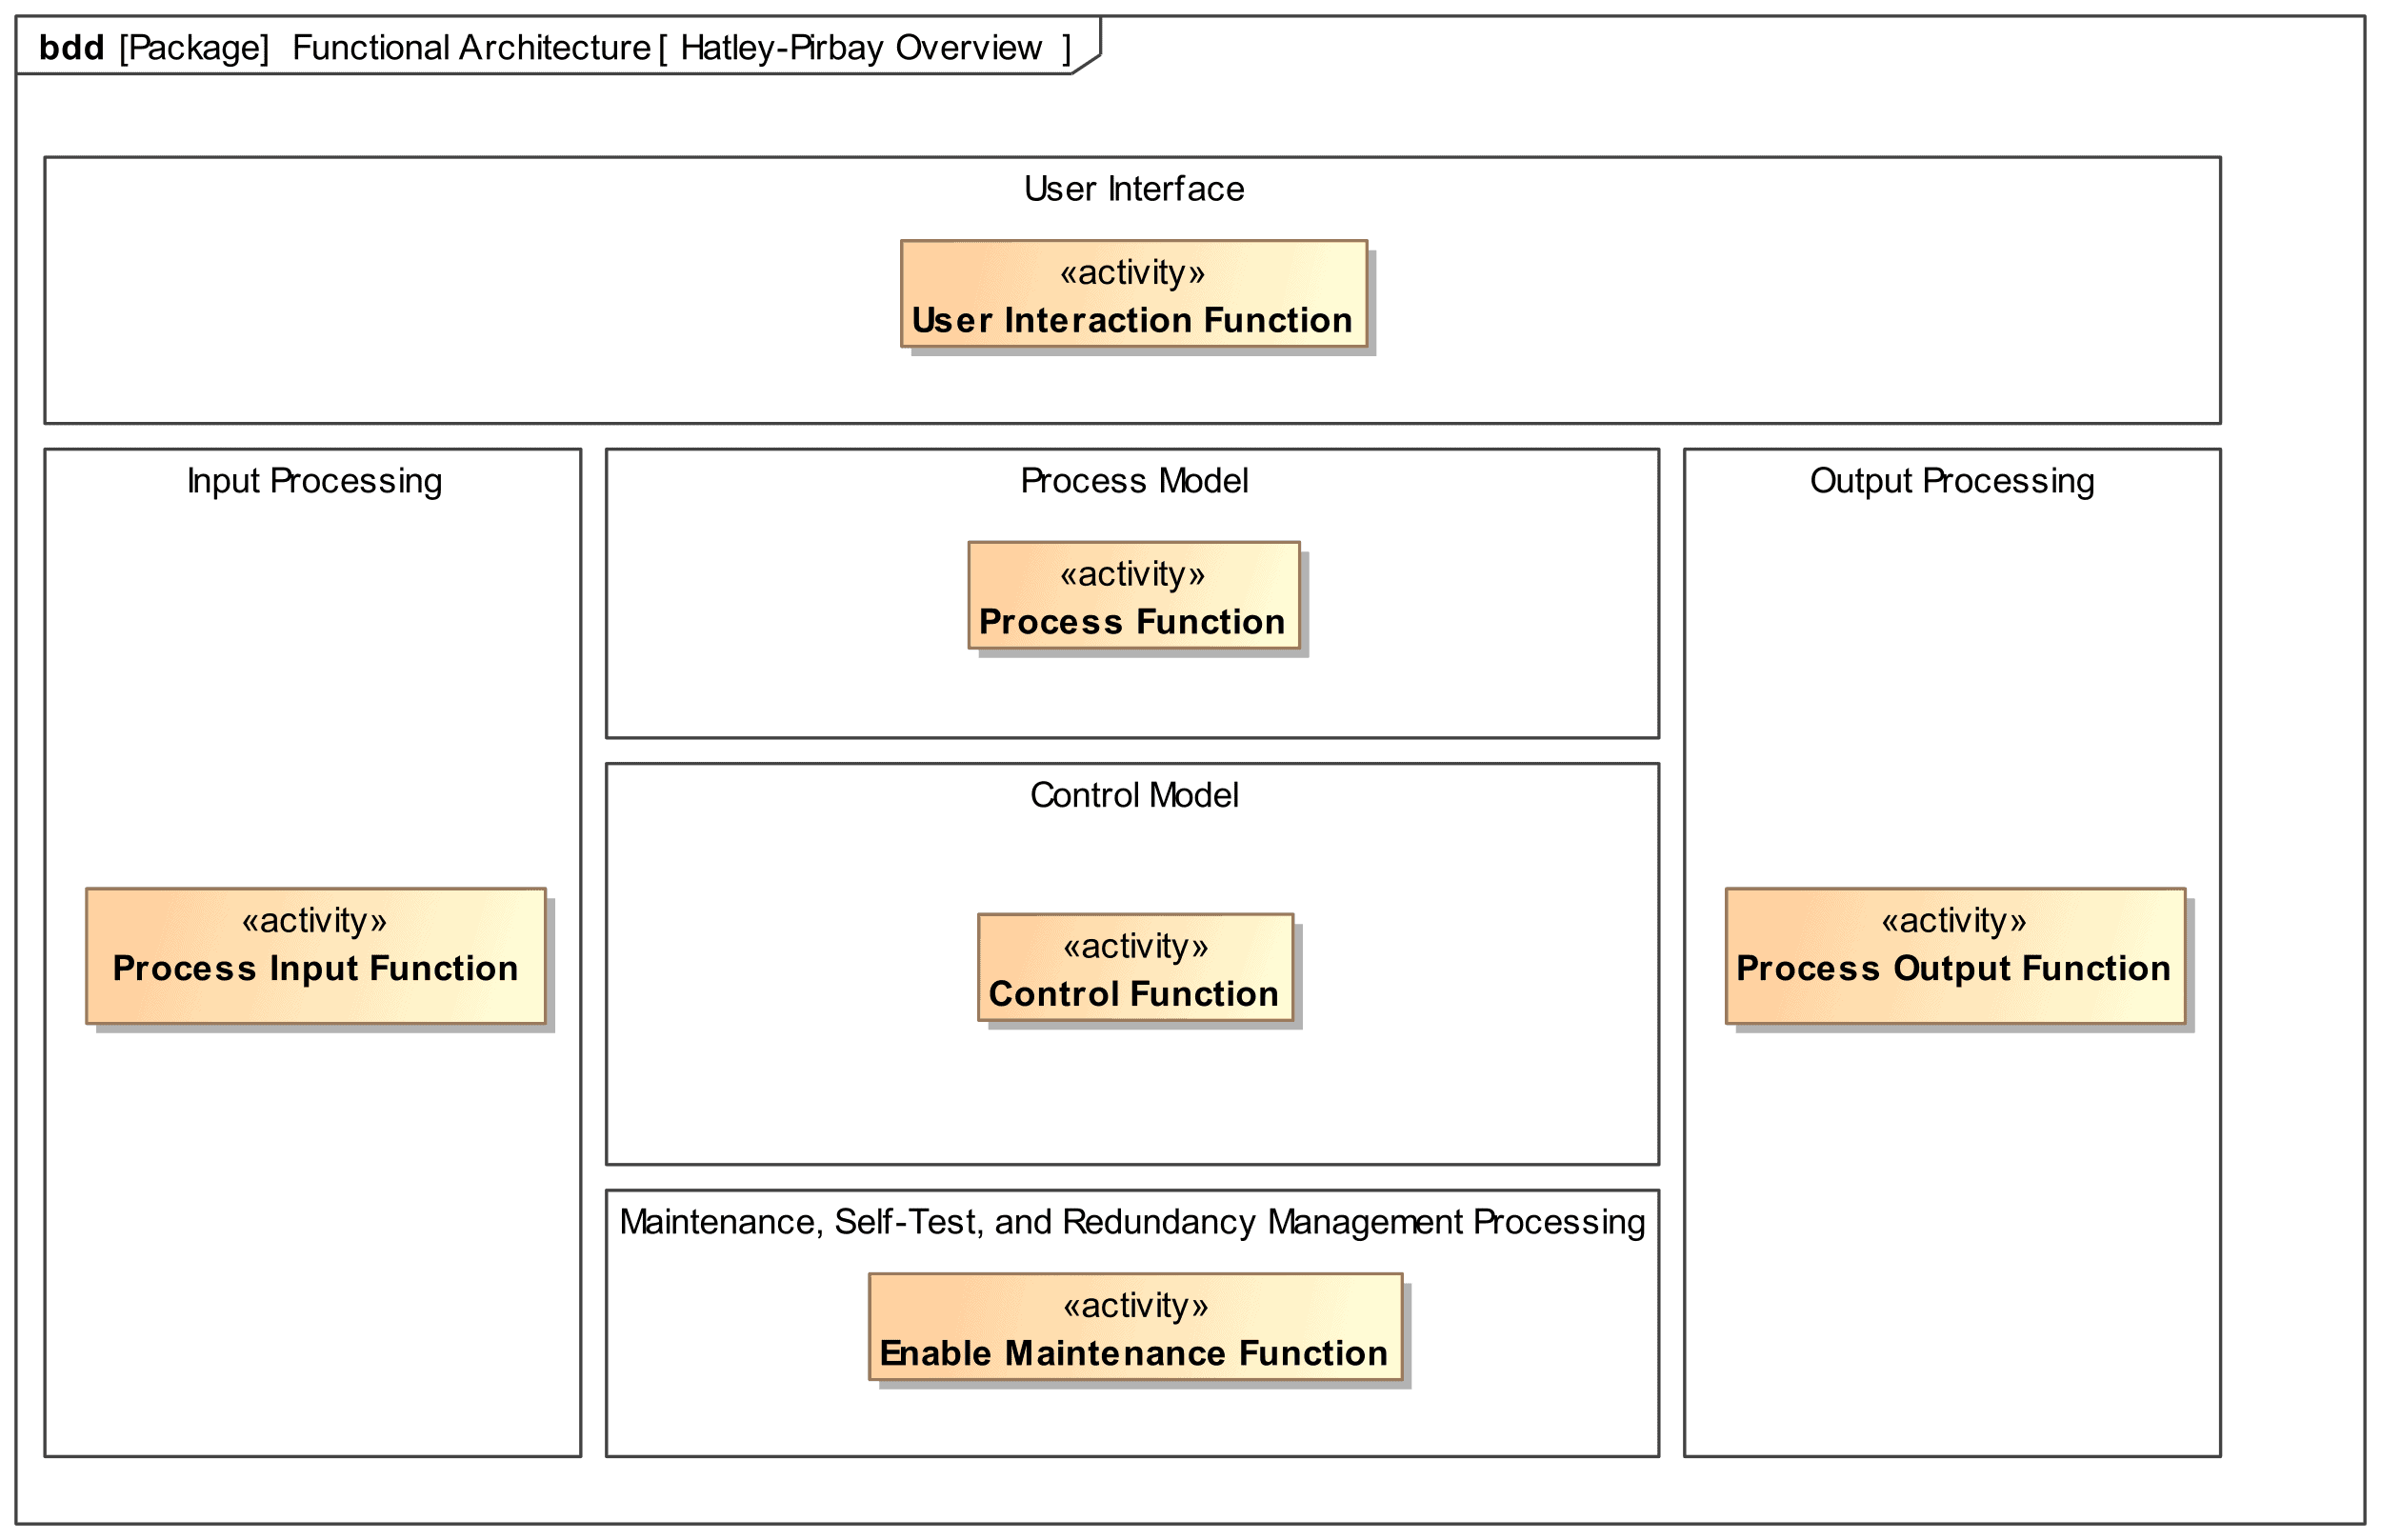
Figure 15. Hatley-Pirbhai template for real-time control systems
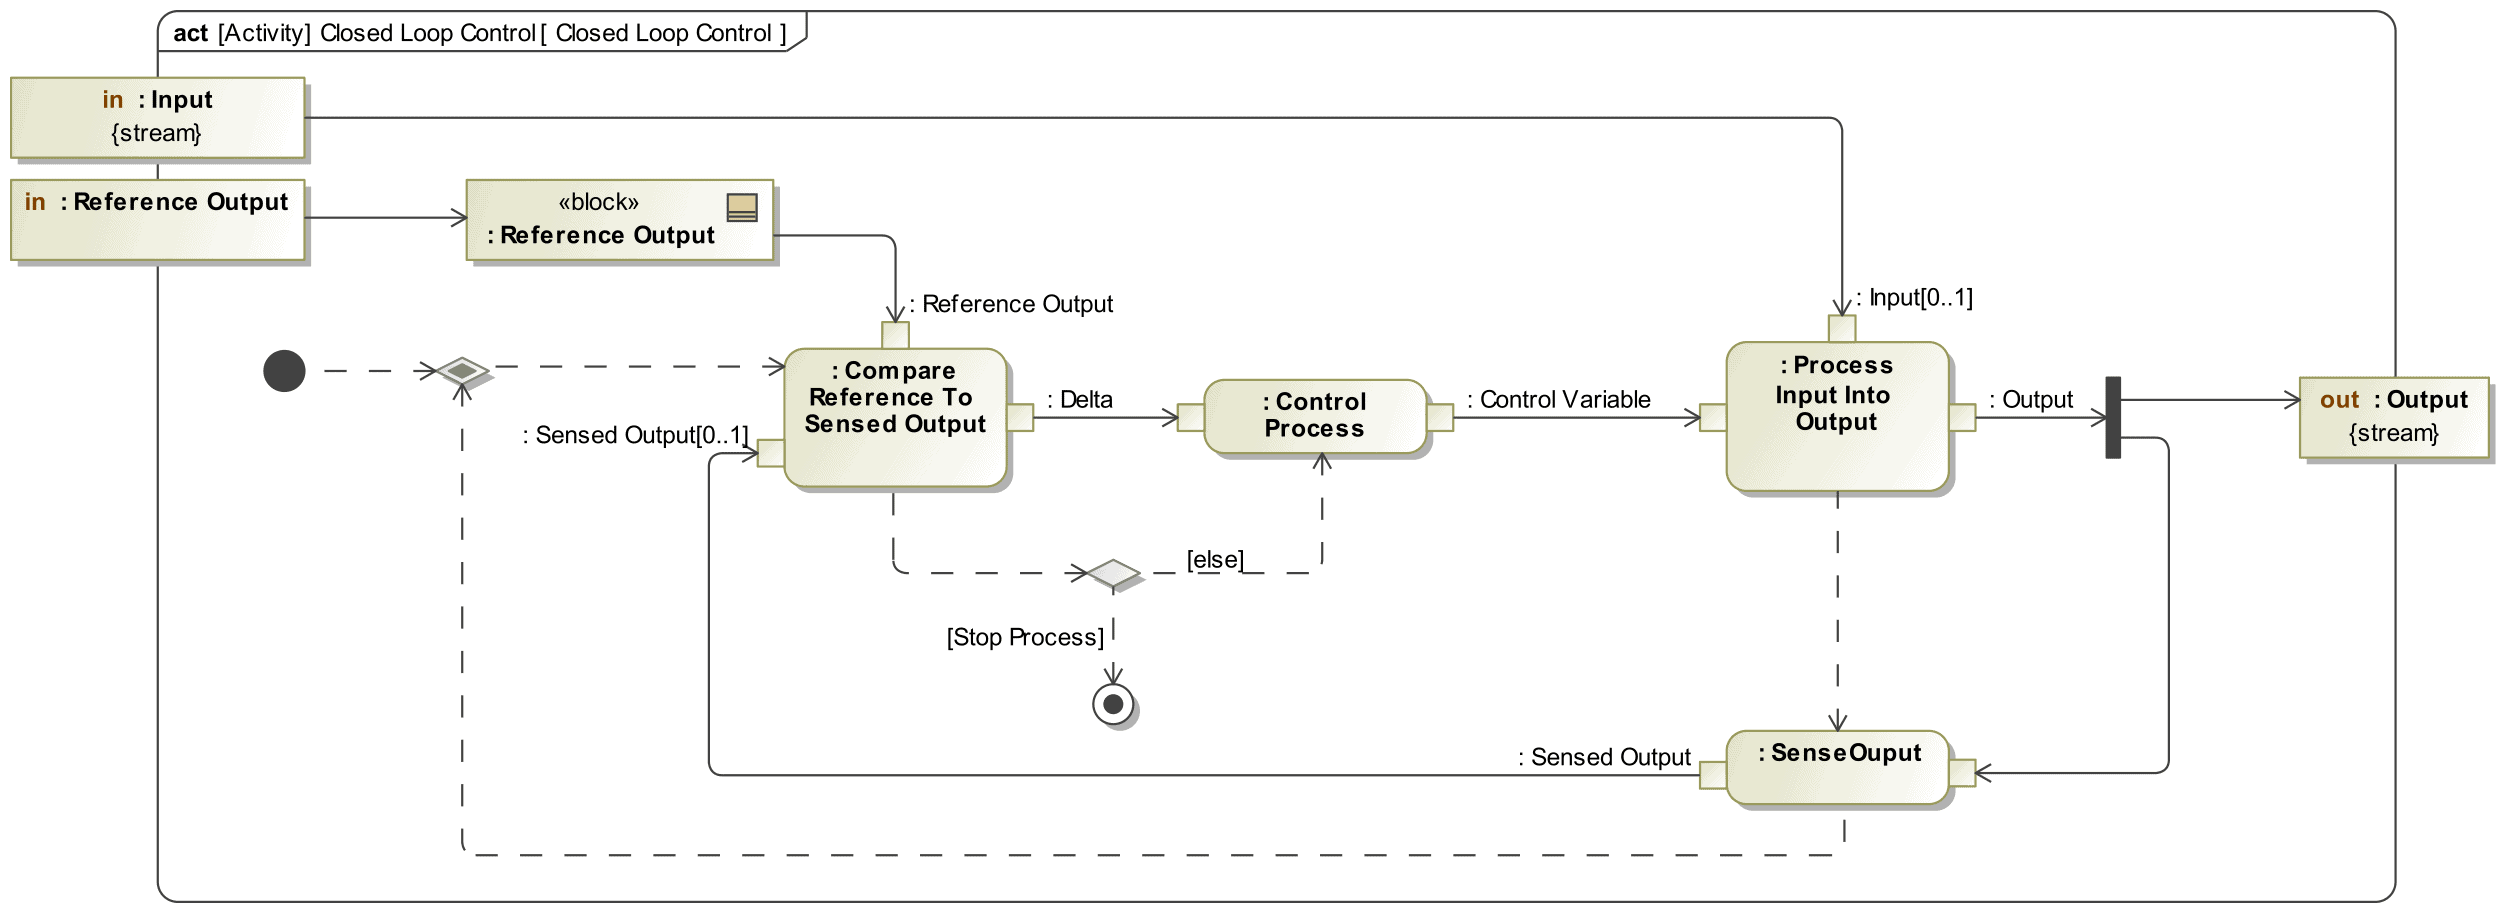
Figure 16. Closed-loop control pattern shown as an activity diagram
If we apply the top-down approach to the EPBS, we can easily identify functions from the capabilities that are consistent with the Hatley & Pirbhai template, for example:
- User interface functions, like capturing the driver’s intention or indicate the parking status visually,
- The process function, i.e. produce braking force,
- Control functions, like the one to confirm that the brake must be engaged or release (manually or automatically), or the one to control the produced braking force.
- Input processing functions, like the function to measure the slope inclination to know how much braking force the EPBS must produce if engaged.
- Output processing functions, like the one to provide the parking status to the vehicle network.
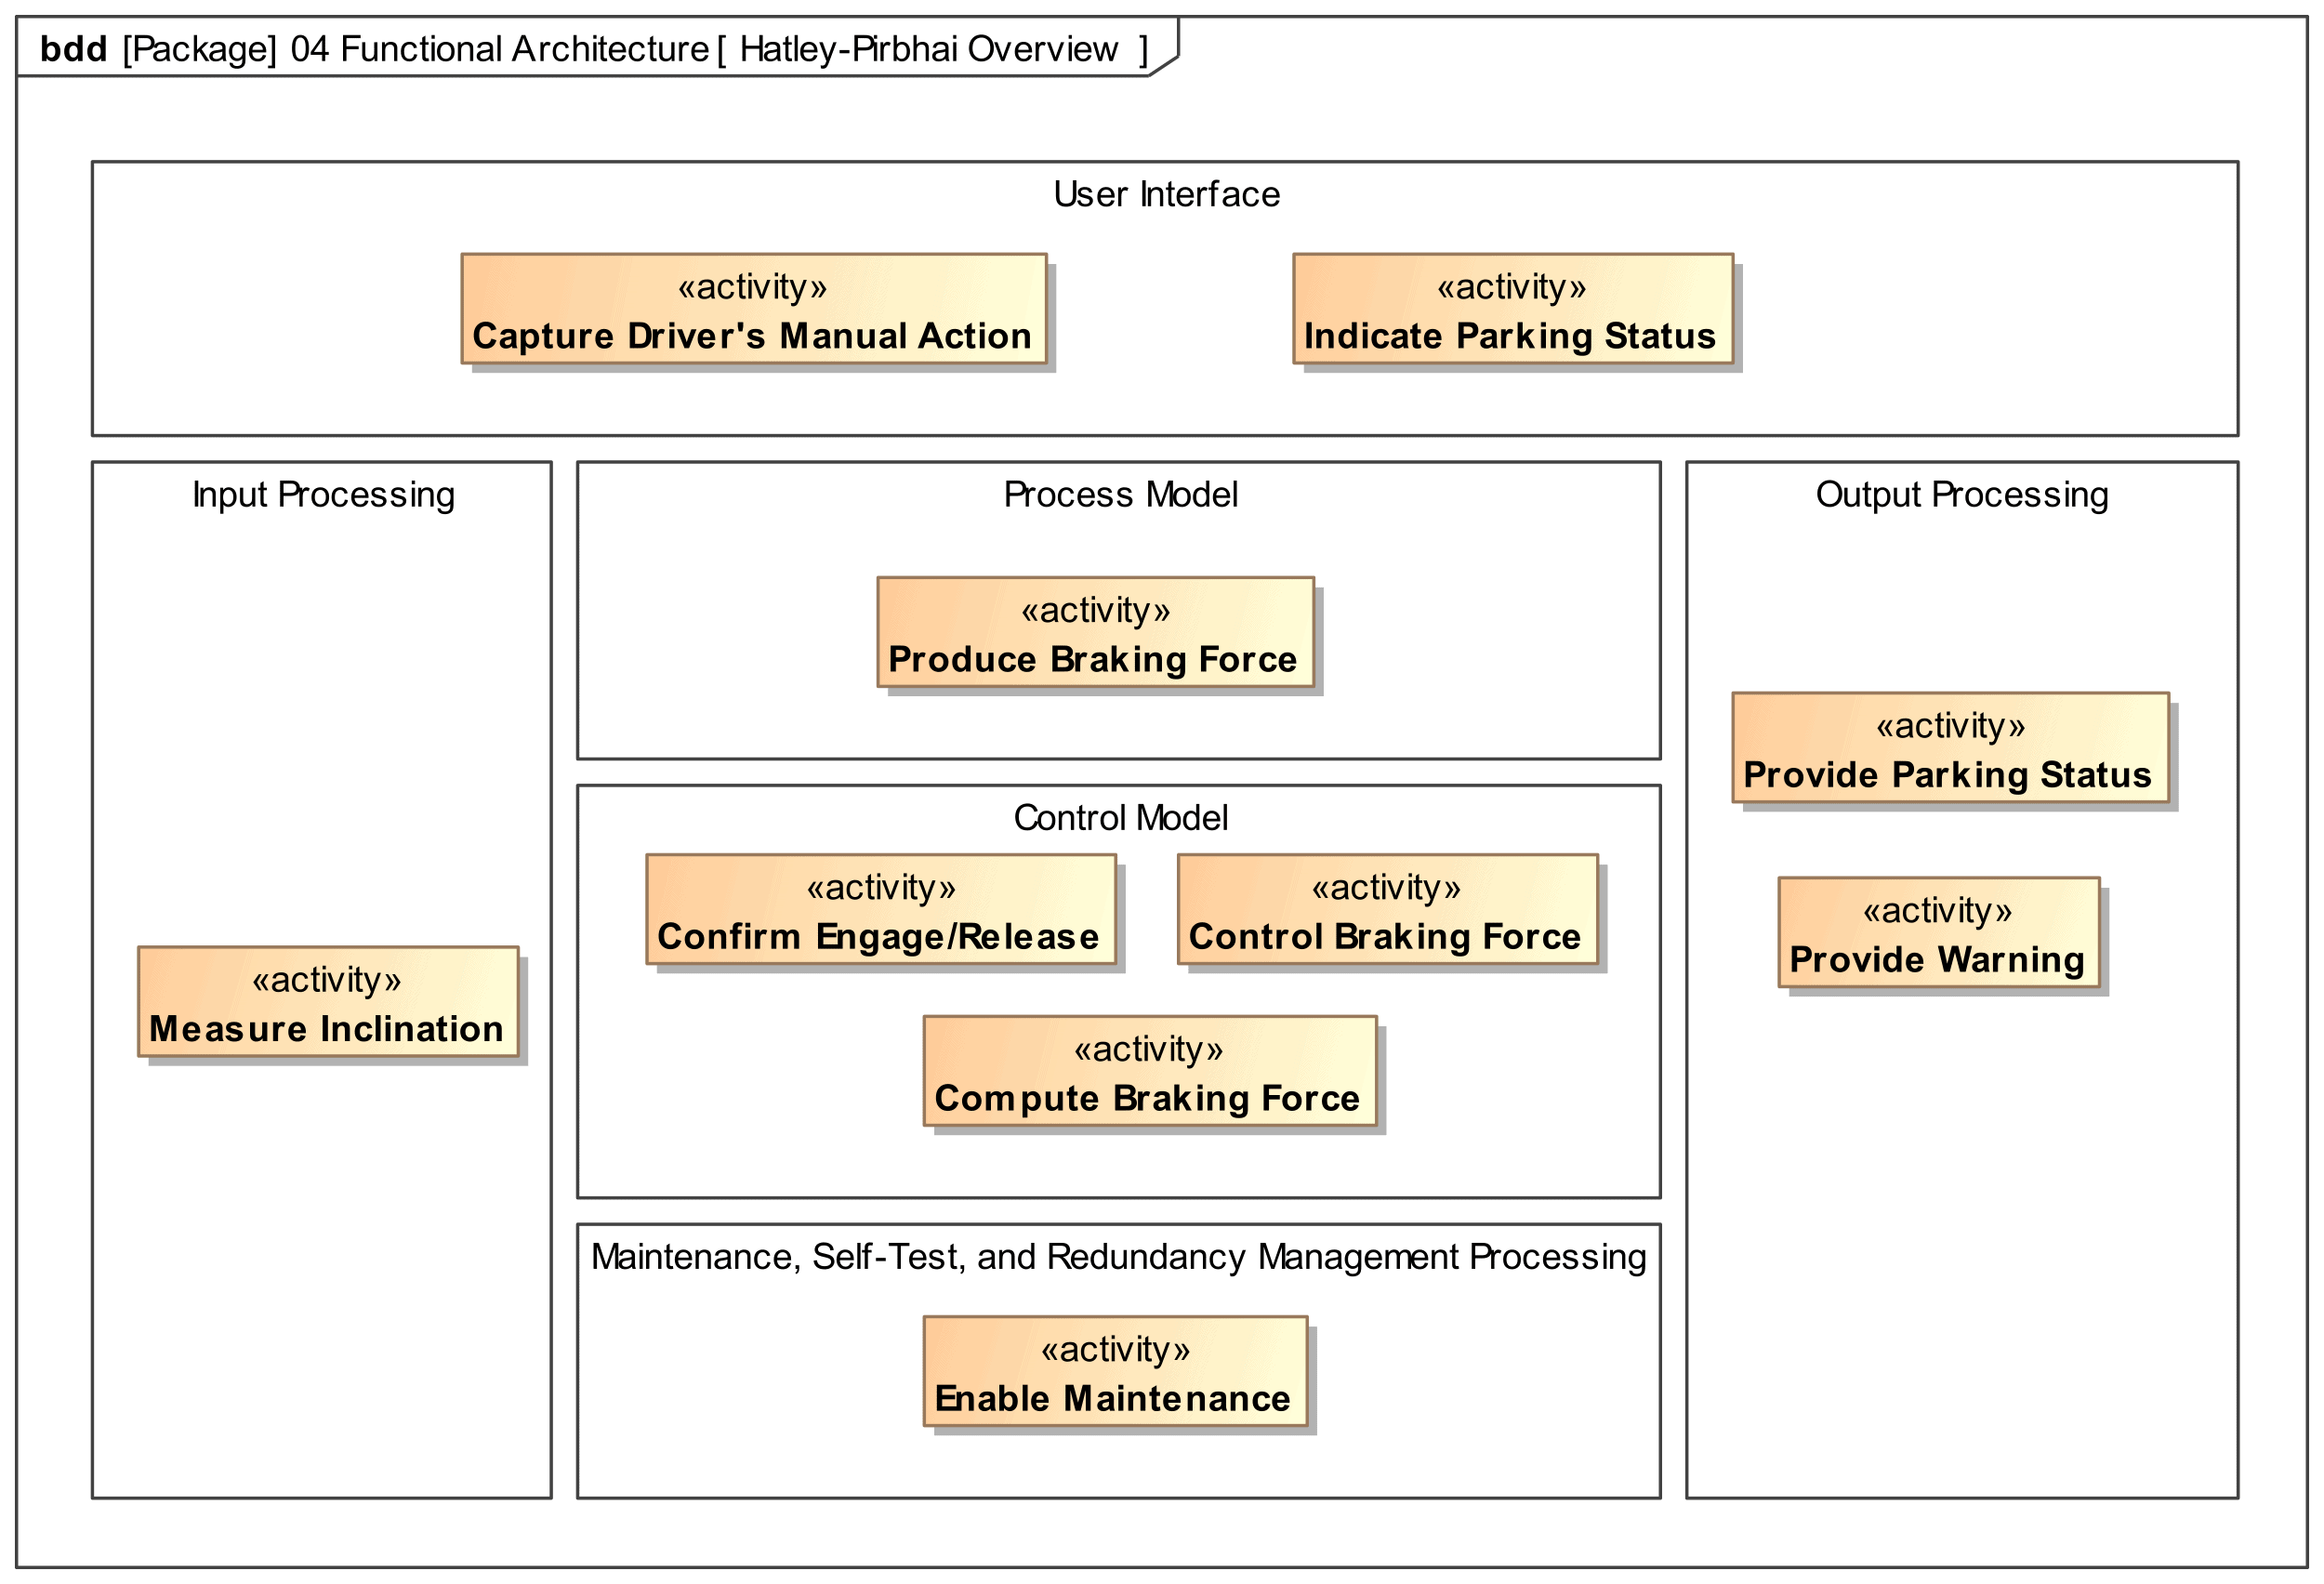
Figure 17. Identified functions for the EPBS using the Hatley & Pirbhai template
Bottom-up Approach
When using the bottom-up approach for building the functional hierarchy, the engineers select the system operational scenarios obtained in the mission dimension of the ISE&PPOOA process and use them as an input to model the preliminary system functional flows (activity diagrams for the main system responses to external, internal or time events) [2].
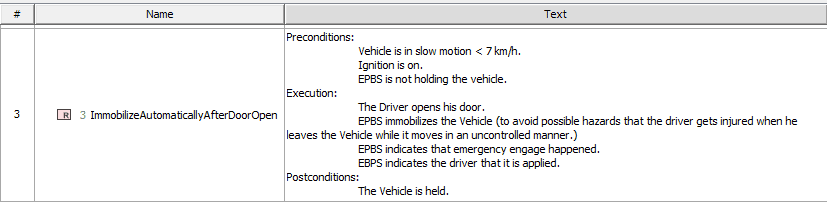
Figure 18. Example of operational scenario for the EPBS
Since these activities and actions are usually in the third, fourth, or even lower levels of the functional hierarchy, they are combined into parent activities (functions) meeting cohesion properties [12]. When cohesive child functions are combined into a parent function, the engineers can represent the complete functional hierarchy tree.
When do we know we are finished with the decomposition? Once we can demonstrate that:
- the proposed functions can realize the needed capabilities, and
- they can realize the operational scenarios, and
- all context interactions are covered, i.e. all inputs to the system are linked to system outputs through possible functional flows, and
- they can be mapped to physical elements to create system concepts.
The functional decomposition template will be shown in a block definition diagrams as in Figure 19.
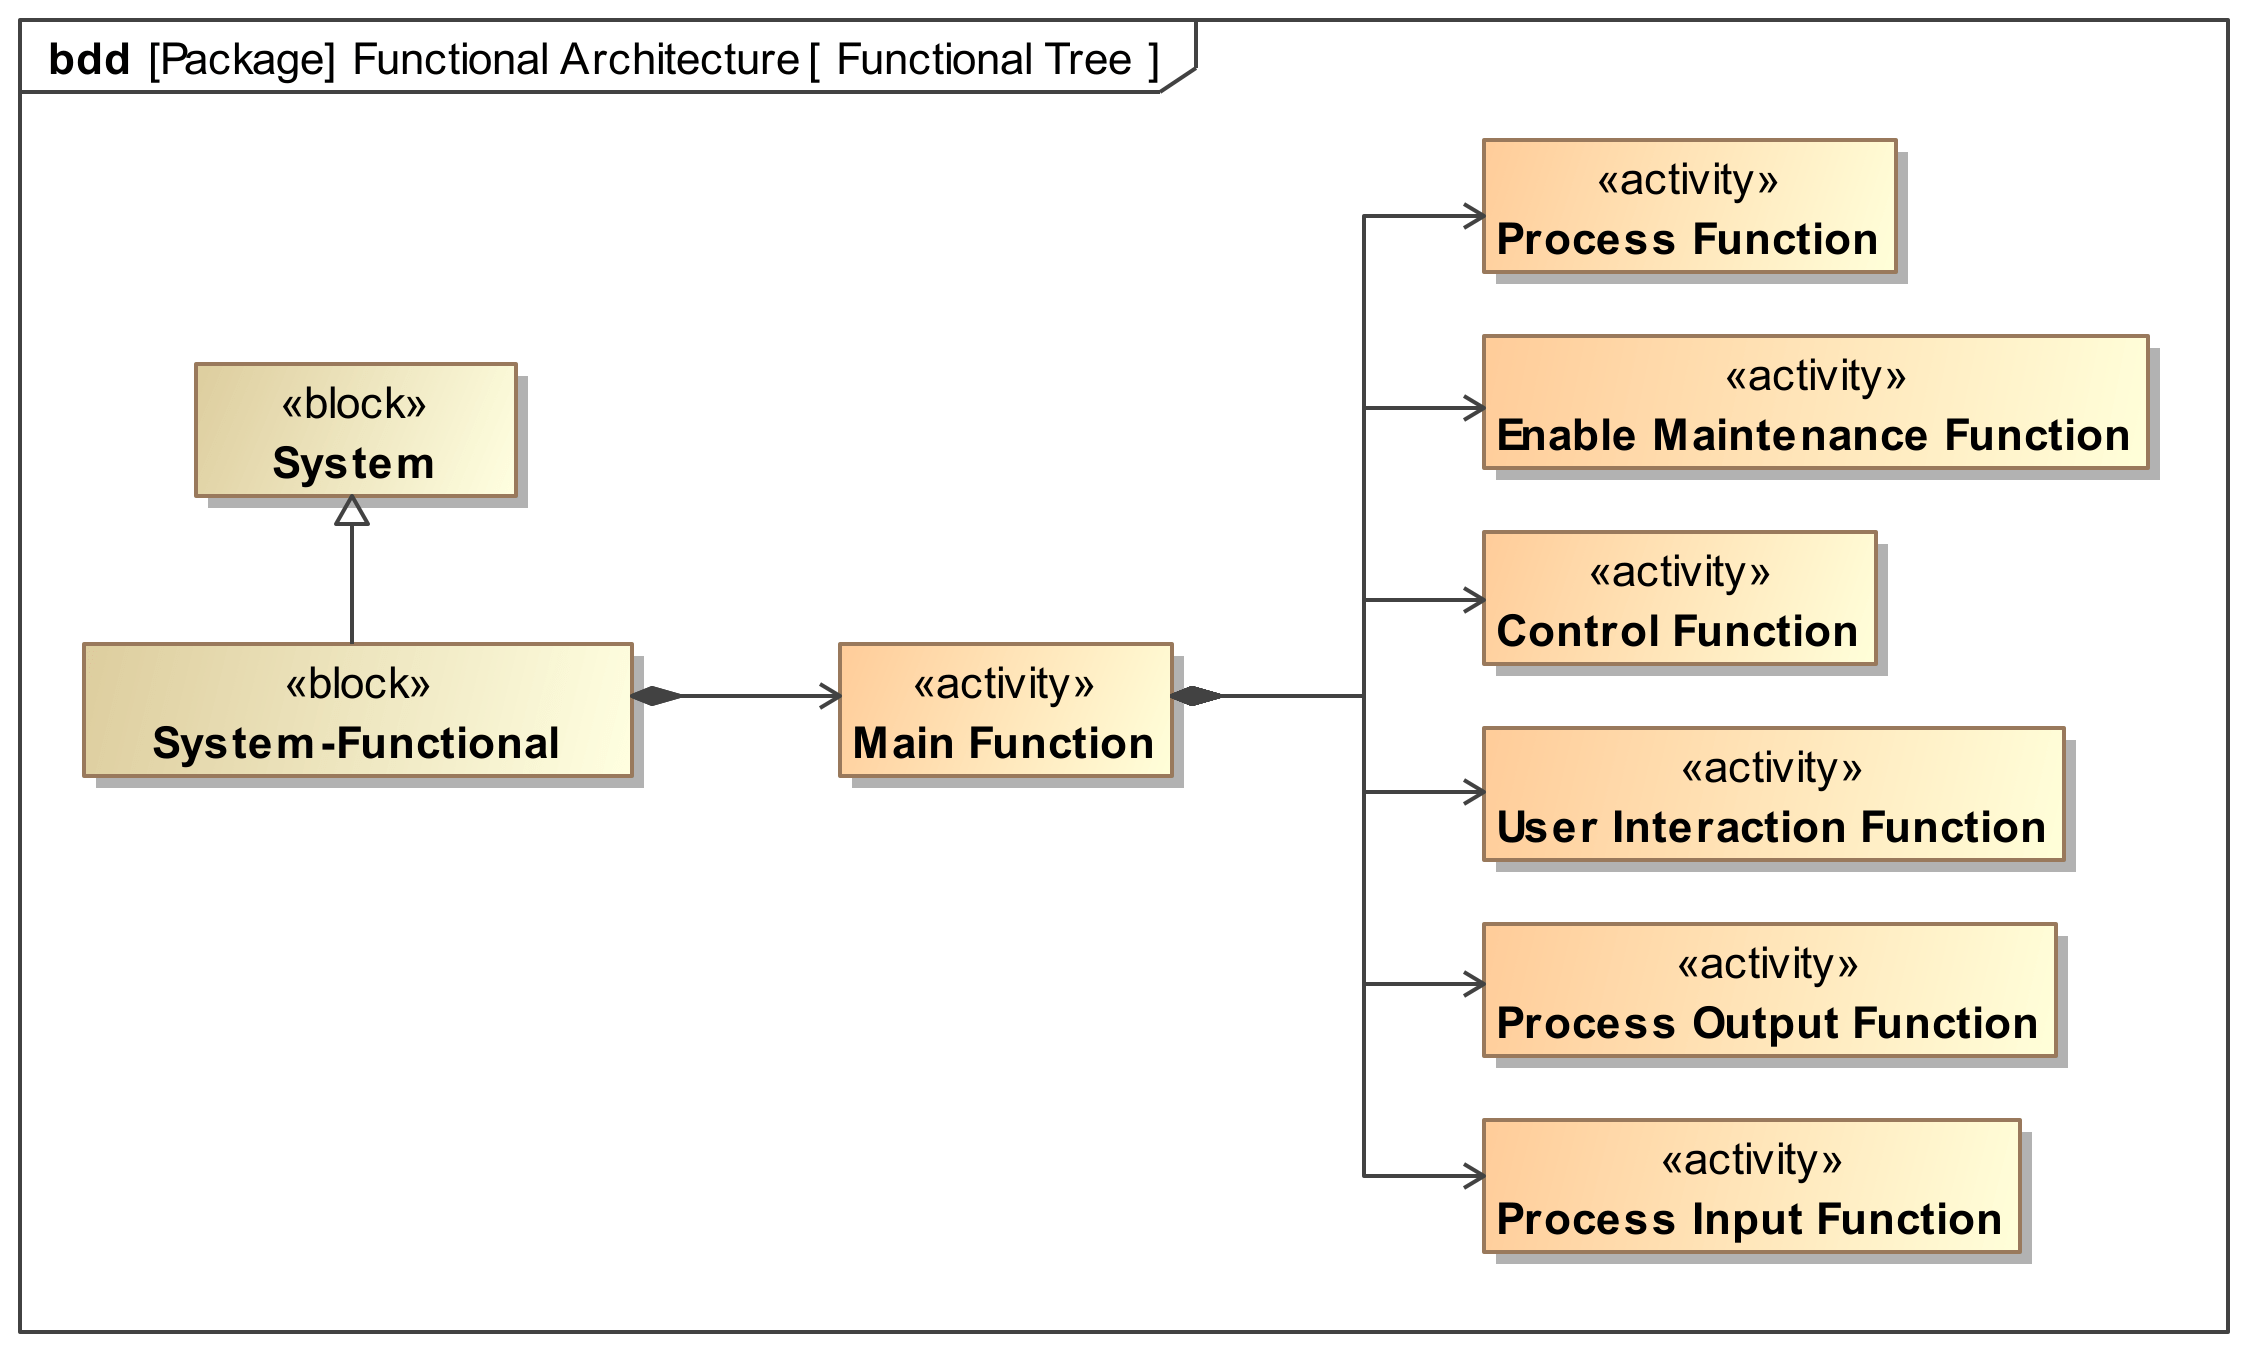
Figure 19. Template structure for the Functional Tree
If we apply the bottom-up approach to the EPBS, we will see that we need functions to validate that a manual release can be done (i.e. ignition is on and the brake pedal is pressed when the release command is received from the driver, Validate Manual Release), or to validate that the EPBS must be engaged automatically to avoid a hazardous situation (Validate Automatic Engage), as in described in the scenario shown in Figure 18. Once it is confirmed that the EPBS must be engaged, the EPBS must calculate the target braking force (Calculate Engage Braking Force) based on the measured inclination. We can group these functions within the umbrella of a Confirm Engage/Release function, which will yield the target braking force (null in case of releasing the brake) which will be used by the Control Braking Force function to create the needed control signal to Produce Braking Force to immobilize the vehicle.
An example of the functional tree for the EPBS is shown in Figure 20.
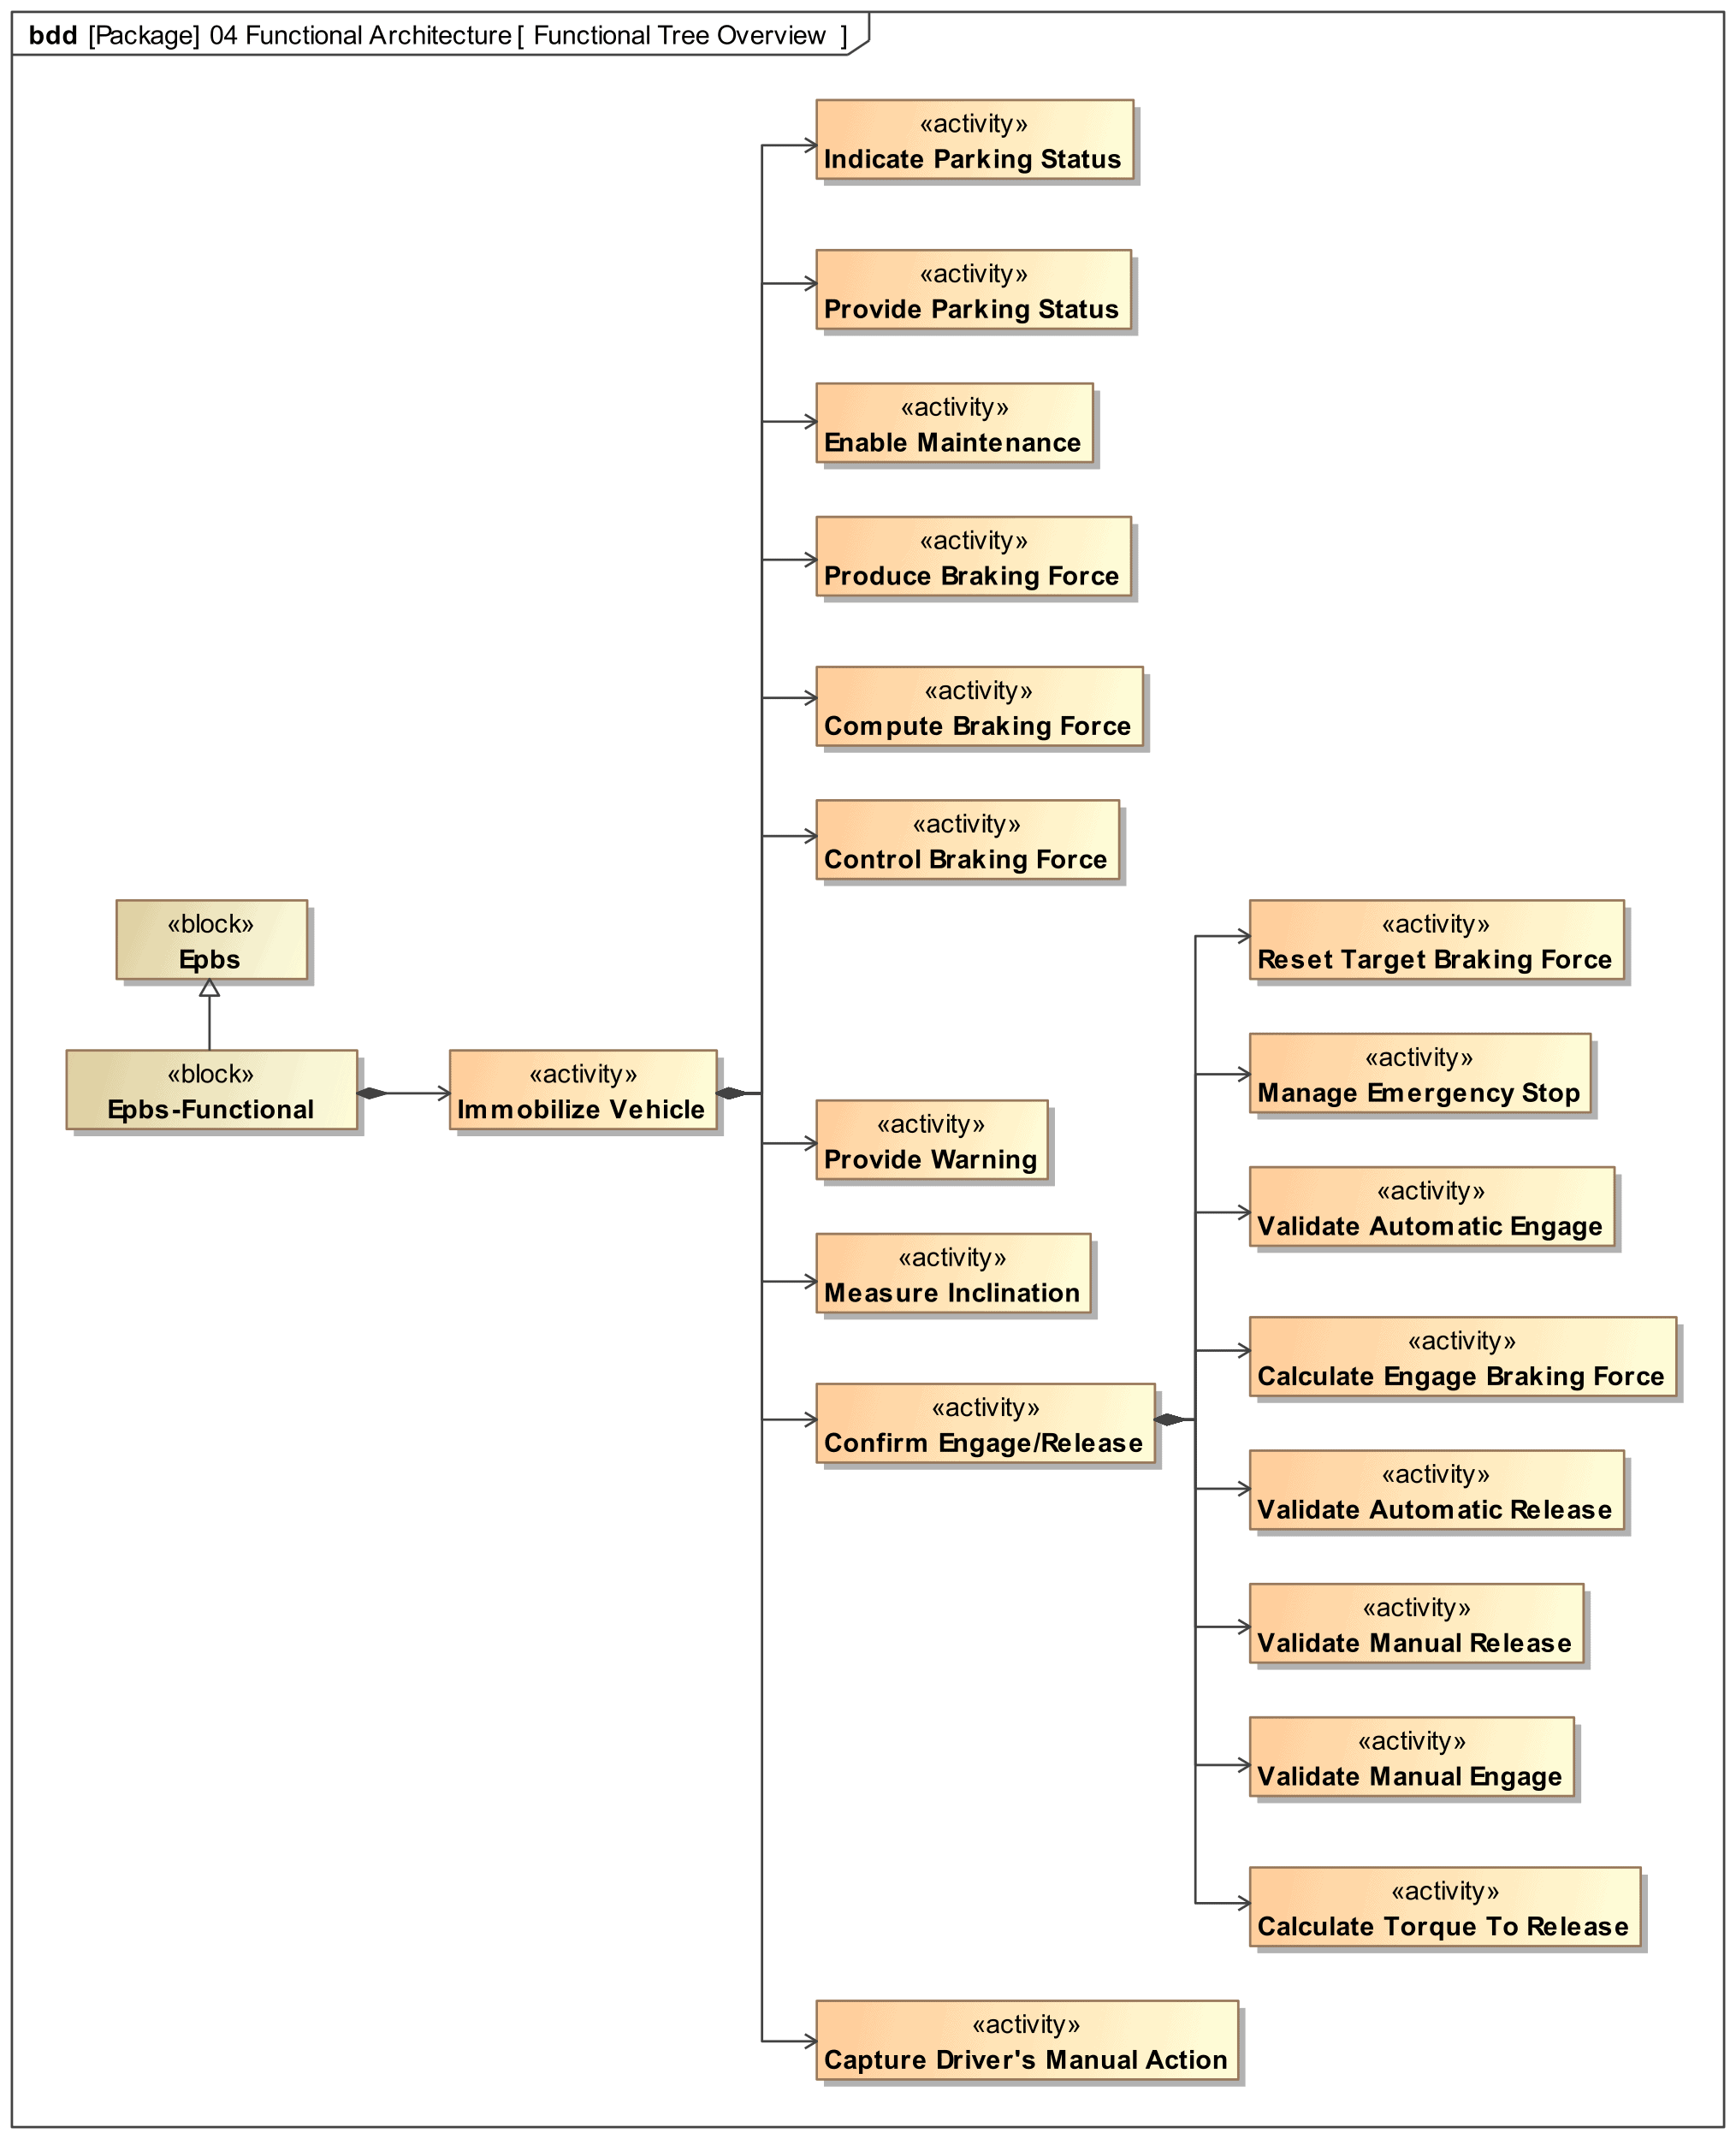
Figure 20. Example of functional tree for the EPBS
Represent the Functional Architecture
Once we have the functional tree, we can proceed to discover the dependencies between functions. To do that we will follow the next steps:
- Select a group of functions from the functional tree
- Create a N² chart to show the flows of matter, energy, and data between functions
- Create an activity diagram for each functional flow identified based on the dependencies represented in the N2 chart and add additional control flows to coordinate the activation of the selected functions.
We will make use of the simulation capabilities of the tool to validate that the modeled functional architecture is behaving according to our expectations.
Figure 21 shows the above-mentioned steps within the scope of the ISE&PPOOA process [2].
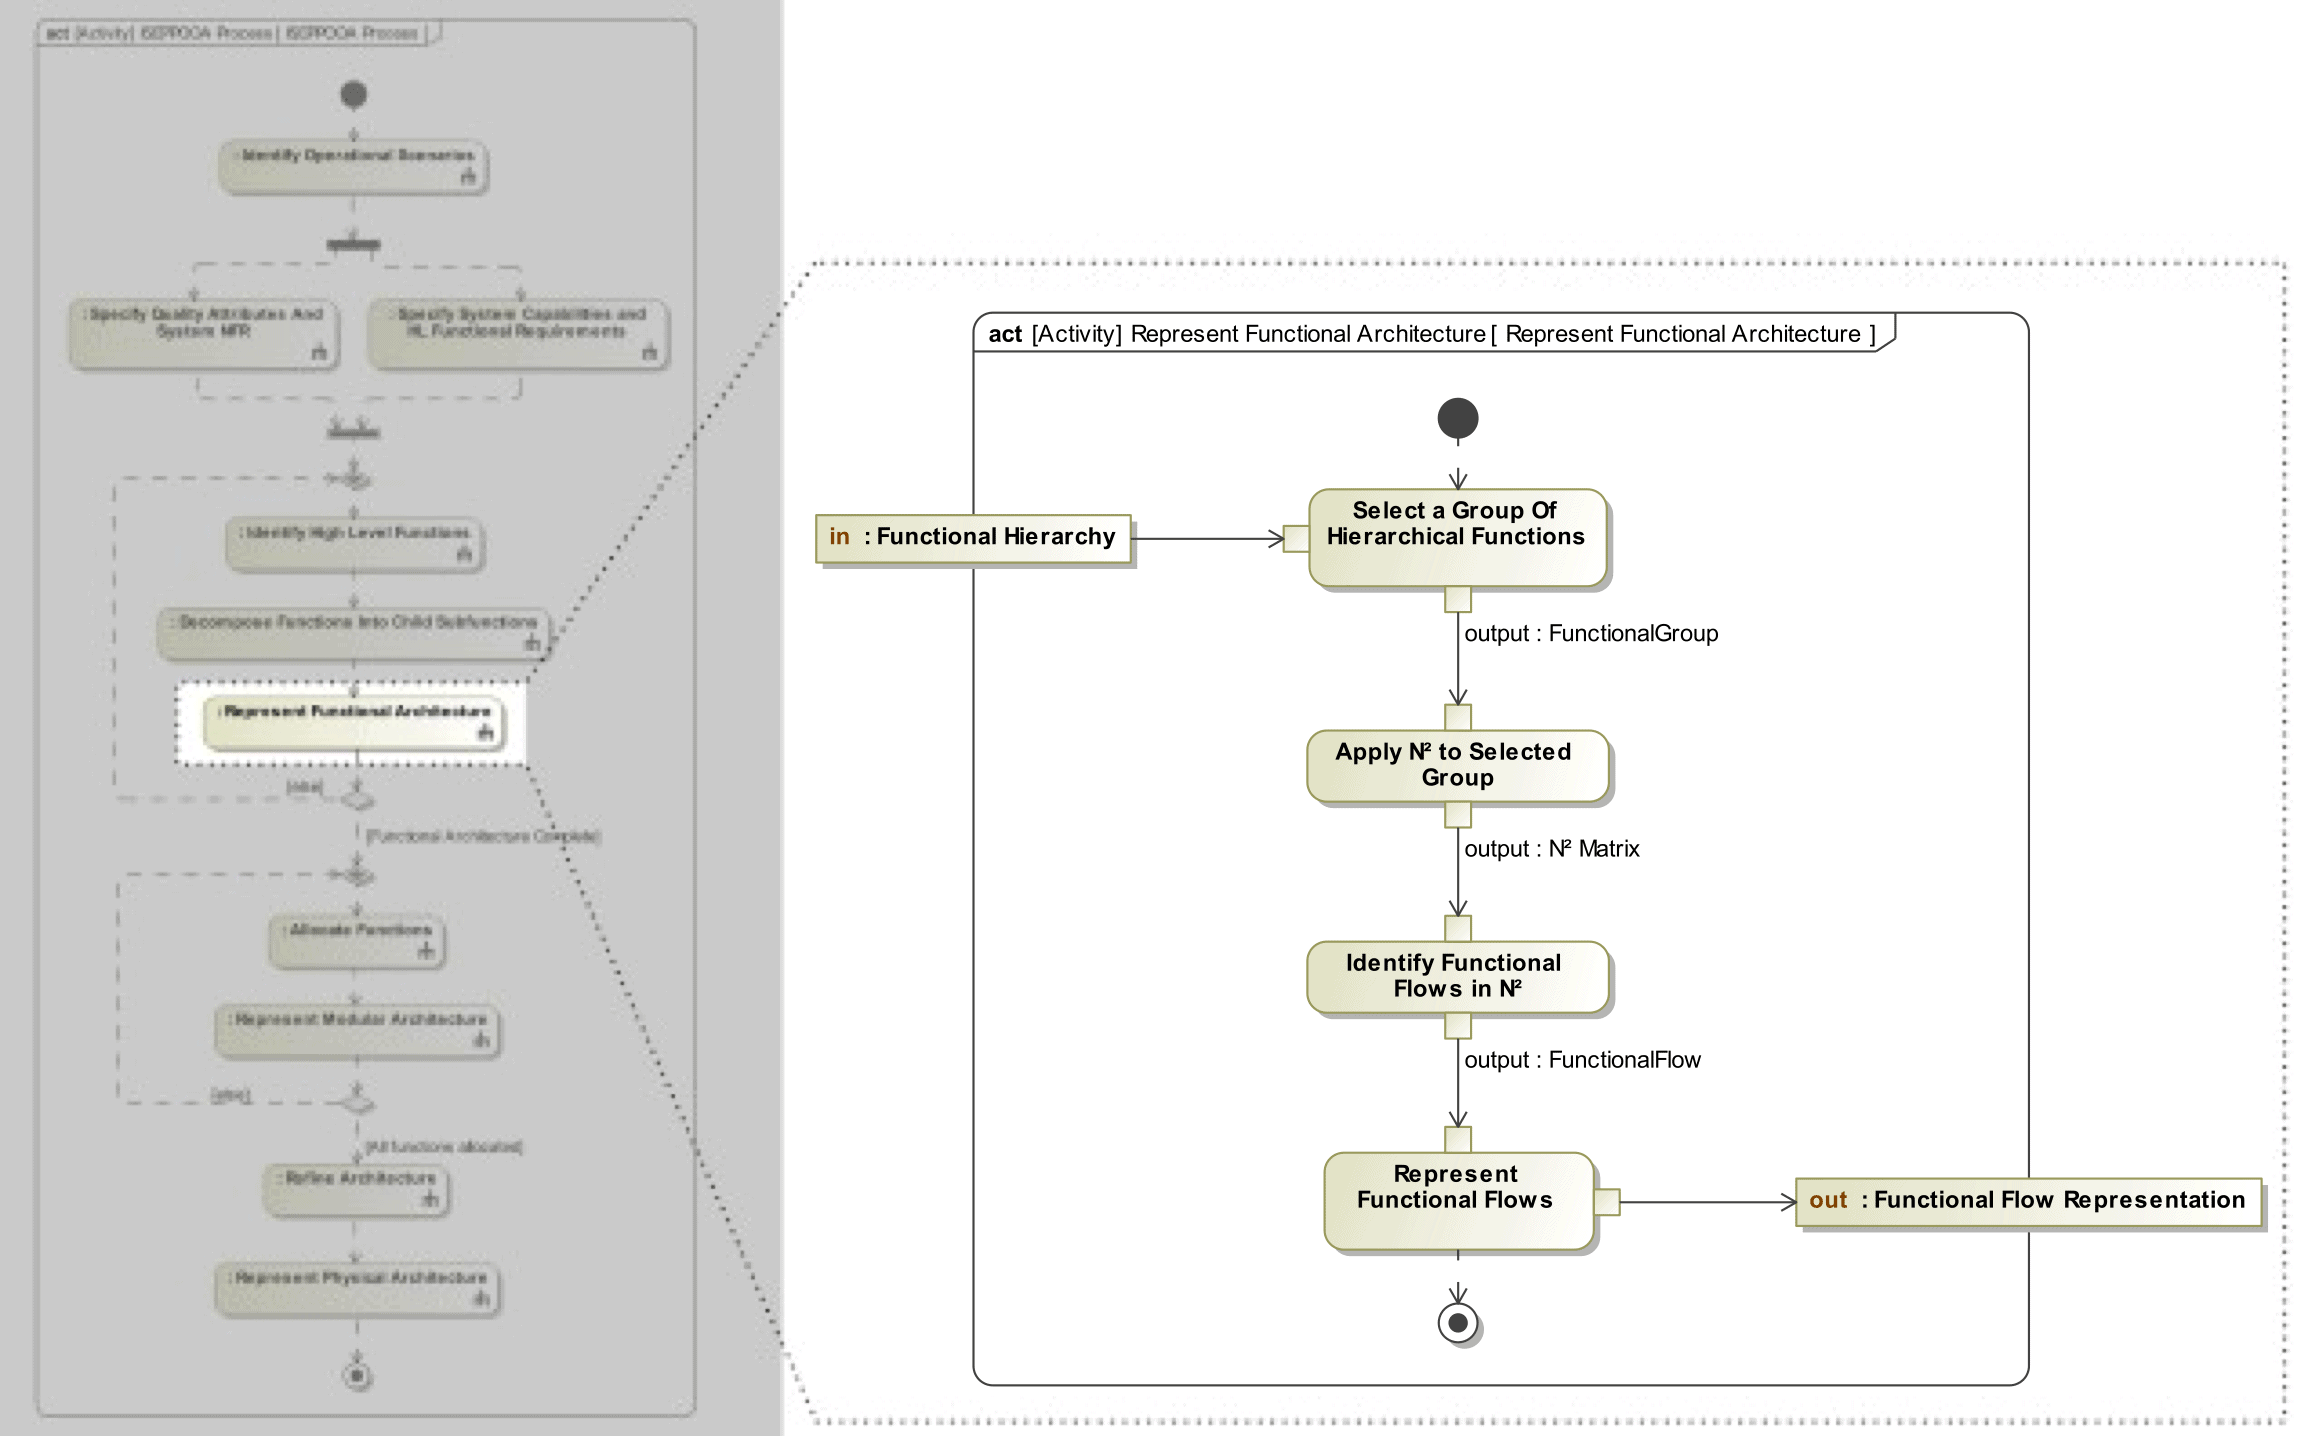
Figure 21. “Represent Functional Architecture” steps within the ISE&PPOOA process
Select a Group of Hierarchical Functions
The first step to build the functional flows is to select a group of functions from the functional tree. Initially, we should focus on the group of functions that will deliver the most important outputs, i.e. that functionality for which the system is going to be built. Once the functional flow for the main function is created and accepted, we can extend it to include supporting functionality, e.g. such as that for supporting maintenance and service.
In our example, the main functionality allows the vehicle to be immobilized, i.e. those functions to determine whether to engage or release the parking brake, and then control and produce the needed braking force to hold the vehicle in place, as well as to inform the driver about the new status of the system.
Here, we will skip supporting functionality, like that to enable maintenance of the system.
Apply N² to Selected Group
During this step we identify the functional dependencies between the selected functions and represent them schematically in ISE&PPOOA using N² charts, which is extraordinary helpful for building the functional flows because the dependencies between functions can be directly identified in the matrix. The most common functional dependency is the output-input dependency, when an item (matter, energy, or data) produced by one function is used as an input by the next function to produce its output. Conversely, independent input item flows will result in parallel functions.
Moreover, using N² charts helps us identify candidate physical blocks by looking at functional clusters. If several functions are coupled together, then they should be allocated to the same module to obtain a physical architecture with high cohesive modules [5] and minimized interactions between them. Architecting heuristics dependent on maintainability and safety requirements may be applicable as well [2].
To build the N² with the tool, we create a preliminary activity diagram for the main function within the block representing the functional tree Figure 22.
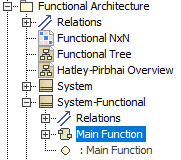
Figure 22. Create the activity diagram within the functional tree block
Then we create a dependency matrix (Figure 23) within the package and configure it in the following form:
- Row element types are CallBehaviorAction, OutputPin and AcceptEventAction
- Column element types are CallBehaviorAction, InputPin and SendSignalAction
- Both row and column scopes are the “Main Function” activity diagram,
- Dependency criteria is ObjectFlow
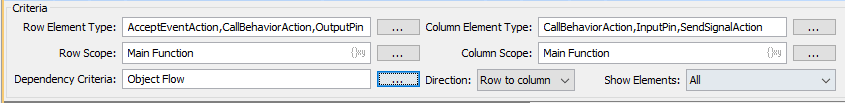
Figure 23. Dependency Matrix properties for building the N²
Finally, we open both dependency matrix and activity diagram in parallel windows and drag and drop the group of hierarchical functions that we selected in the previous step of the process (Figure 24).
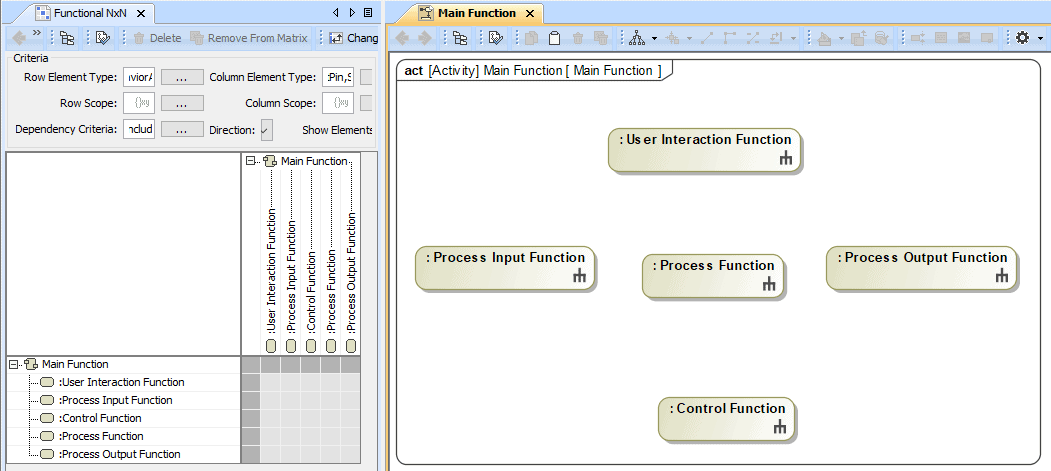
Figure 24. Open the N² and the activity diagram in parallel
Identify Functional Flows in N²
For each function, we create the needed output pins and input pins that the transformation will yield and require respectively in the activity diagram, typing them by new signals as needed. Note that the collection of these signal types will be the initial step for building our future data dictionary.
Whenever we add a new pin in the activity diagram, we can see that the N² gets updated accordingly, showing the output pin in the rows under the action, and inputs in the columns (Figure 25).
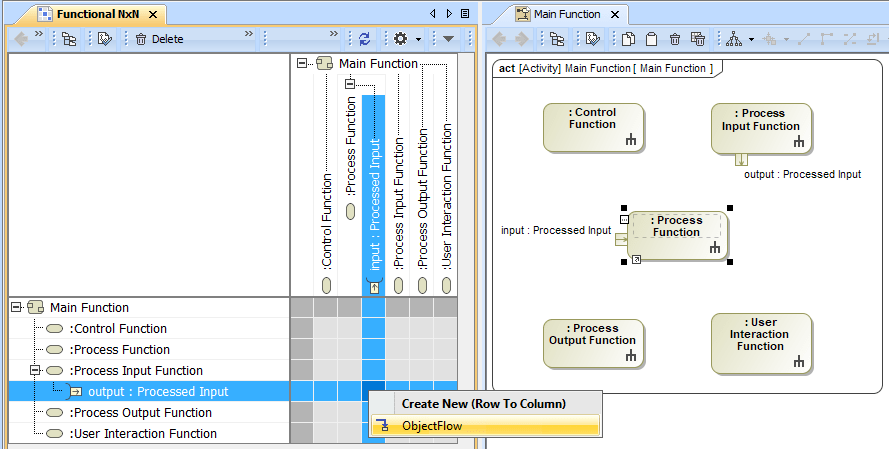
Figure 25. Input and output pins created in the activity diagram are shown in the N² automatically
In a second step, we connect the output pins to the input pins of the internal functions in the N² according to their types to build the functional dependencies between them. We do that by creating object flows in the applicable cells (Figure 25 and Figure 26).
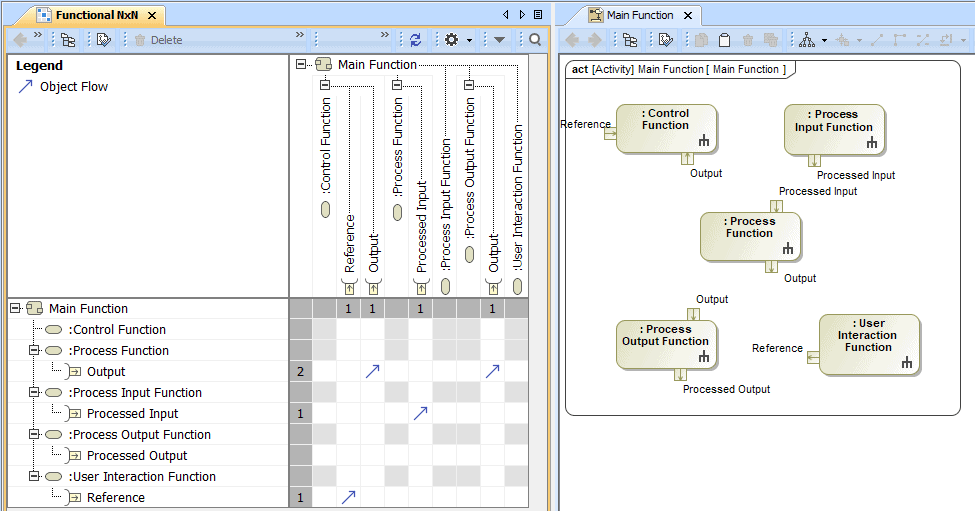
Figure 26. Functional dependencies are added in the N² matrix
Finally, we identify the external inputs to the diagram and outputs required for those functions that have pins not connected with object flows. We create signals for typing them and drag and drop them on the activity diagram, refactoring them to accept-event actions for those that are inputs and send-event actions for the outputs, and we connect them to the needed input and output pins of the internal functions, using the N² (Figure 27).
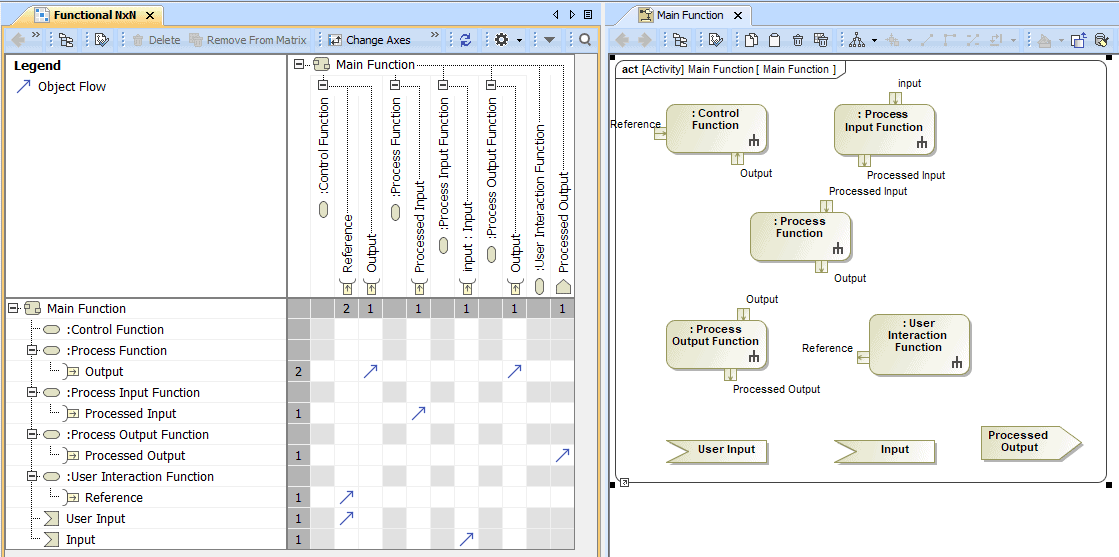
Figure 27. Actions related to external interfaces are added to the diagram and displayed in the N² automatically
Before moving on to the next step, it is highly recommended to sort the N² out to get the matrix upper triangular form, or in case it is not possible, all interactions are as close to the diagonal as possible (Figure 28). We do it by following the recommendations given to sequence a Design Structure Matrix (DSM) [13]:
- Move those functions that do not receive inputs from other functions to the left of the N², i.e. they do not depend on any other function. Those functions can easily be identified by observing an empty column in the N²
- Move those functions that provide no output to other functions to the right. Those functions can easily be identified by observing an empty row in the N²
- Identify feedback loops, combine them as one entity and repeat until the N² is a triangular matrix. Once it is a triangular matrix revert those combinations.
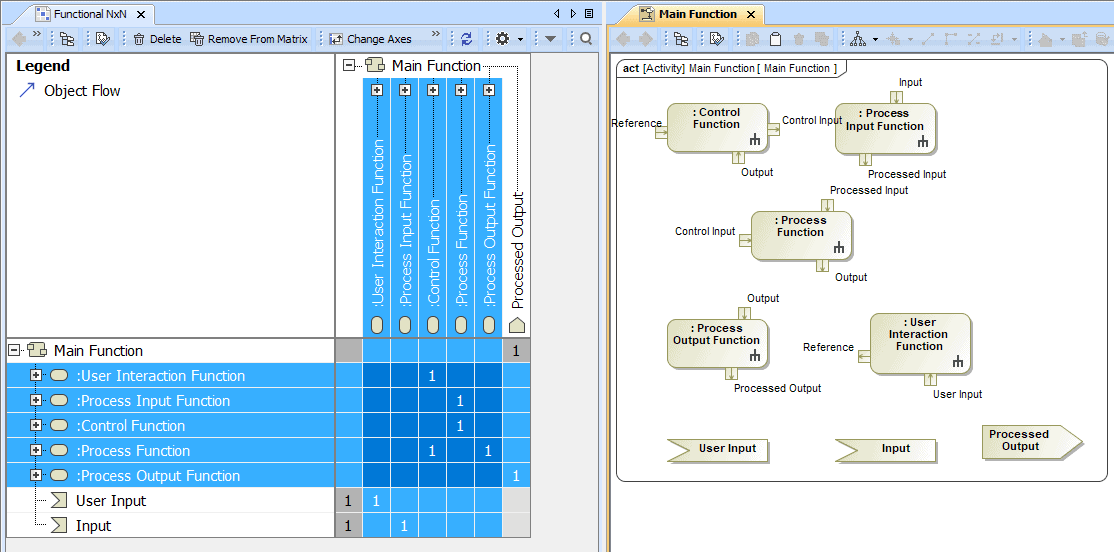
Figure 28. Reorder the matrix until it is upper triangular
The resulting N² matrix for the main functionality of the EPBS is shown in Figure 29. In this case, we obtained a simple upper triangular matrix with no loops.
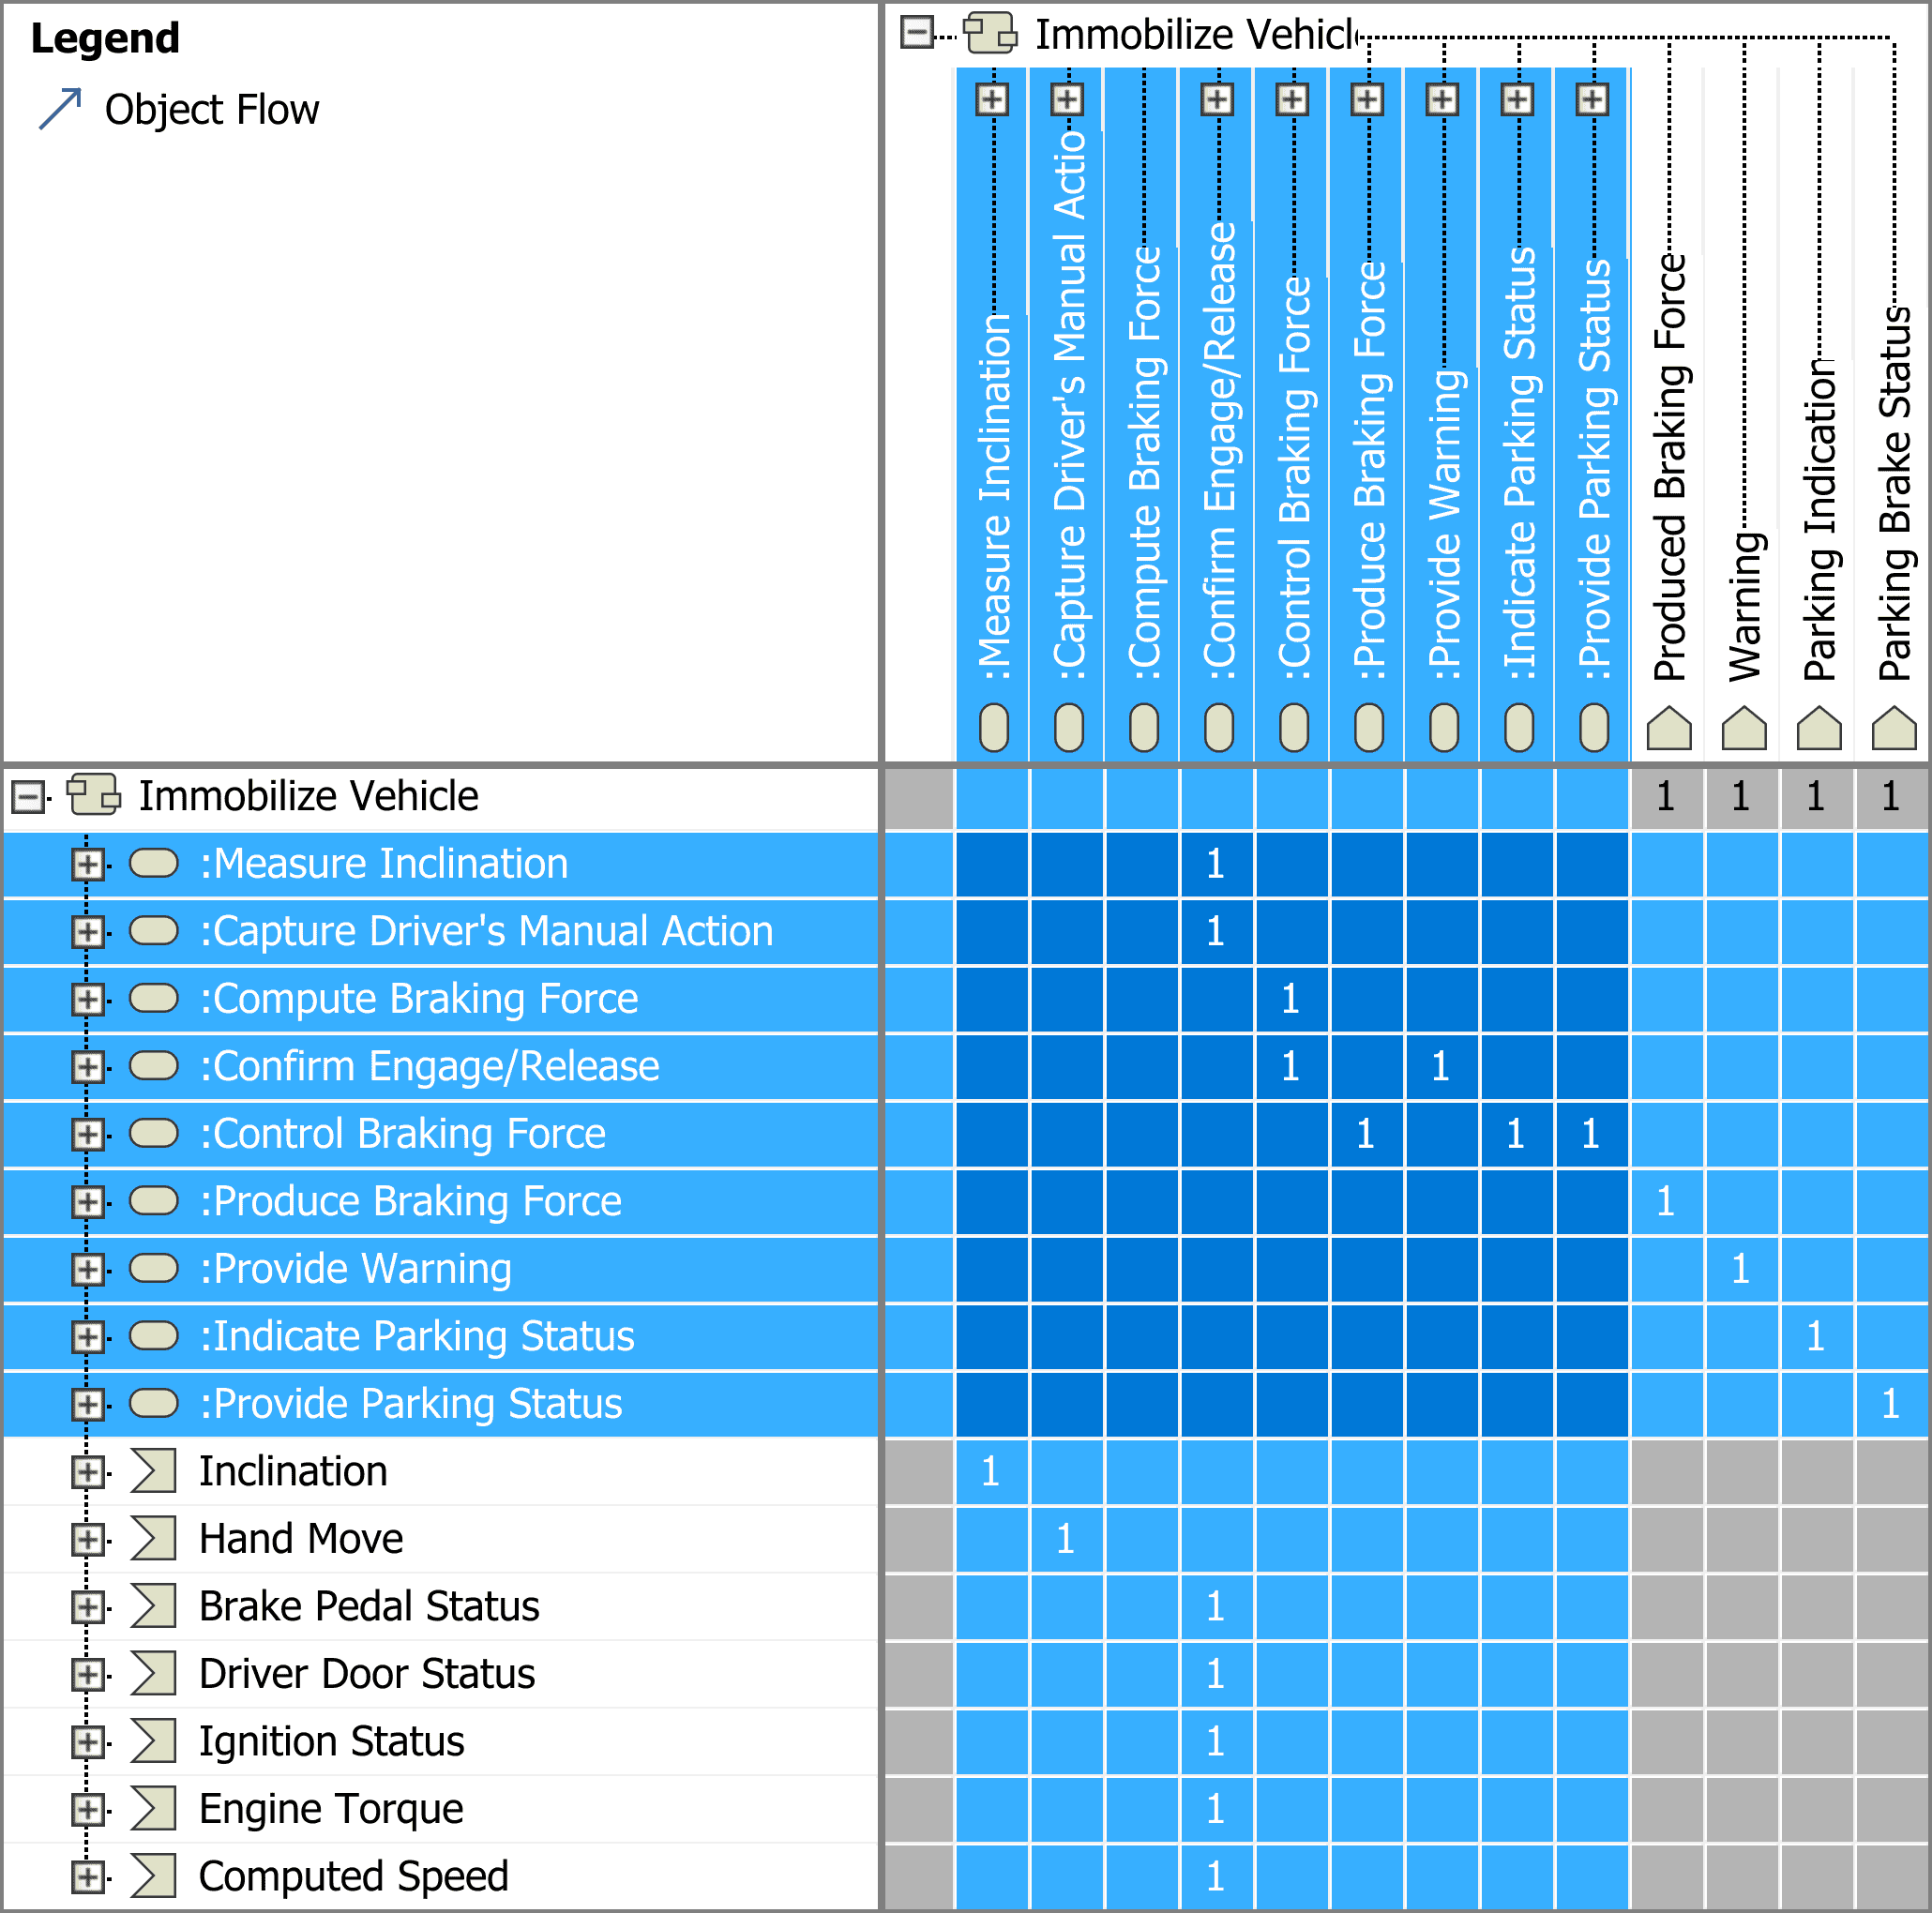
Figure 29. N² matrix for the main functionality of the EPBS
Represent Functional Flows
To represent the functional flows, we finish the N² matrix and focus on the activity diagram. As we already created the object flows in the model, we only need to display them in the activity diagram. For doing that, we select all actions in the activity diagram and request the tool to display all paths. Then, we ask the tool to sort the diagram for us.
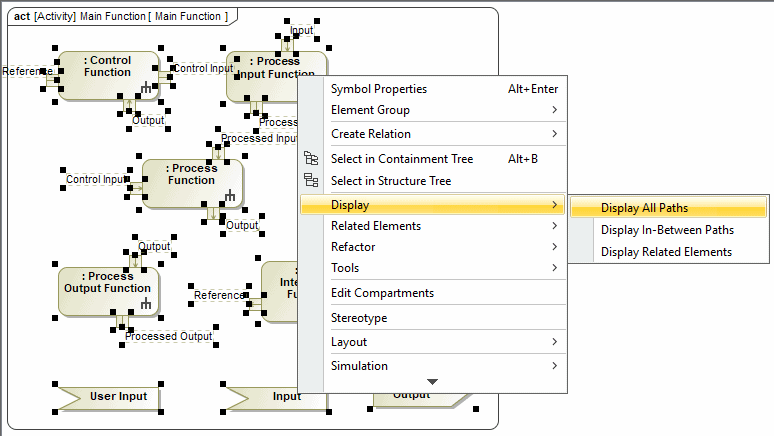
Figure 30. Use “Display All Paths” feature to show the functional dependencies created in the N²
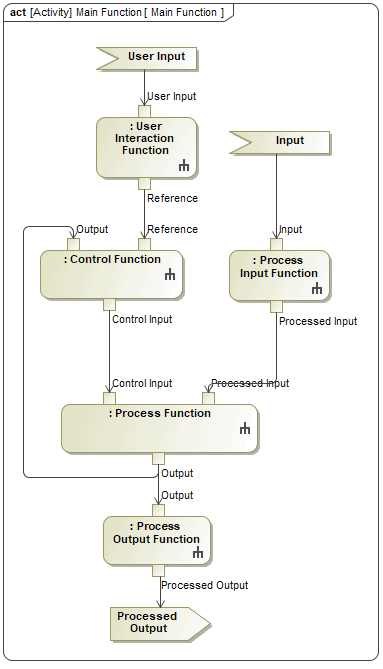
Figure 31. Use the “Quick Diagram Layout” feature to reorder the resulting diagram easily
The resulting diagram will surely not behave according to our expectations during simulation. To fix that behavior we need to:
- Add a “result” pin in the accept events
- Add control flows to regulate the execution of functions.
- Add datastores where required to keep the last value received.
- Change multiplicity of those input pins that receive feedback from output of activities in a loop to 0..1. We will consider that there is no current value for that input pin (i.e. the first time it runs), it will use internal default value. Alternatively, an initialize function could be created at the beginning of the flow to feed the initial value of that input.
We recommend validating each change using the simulation capabilities of the tool, until we see that the simulated behavior is according to the one we envisioned. The final functional flow is represented in Figure 32.
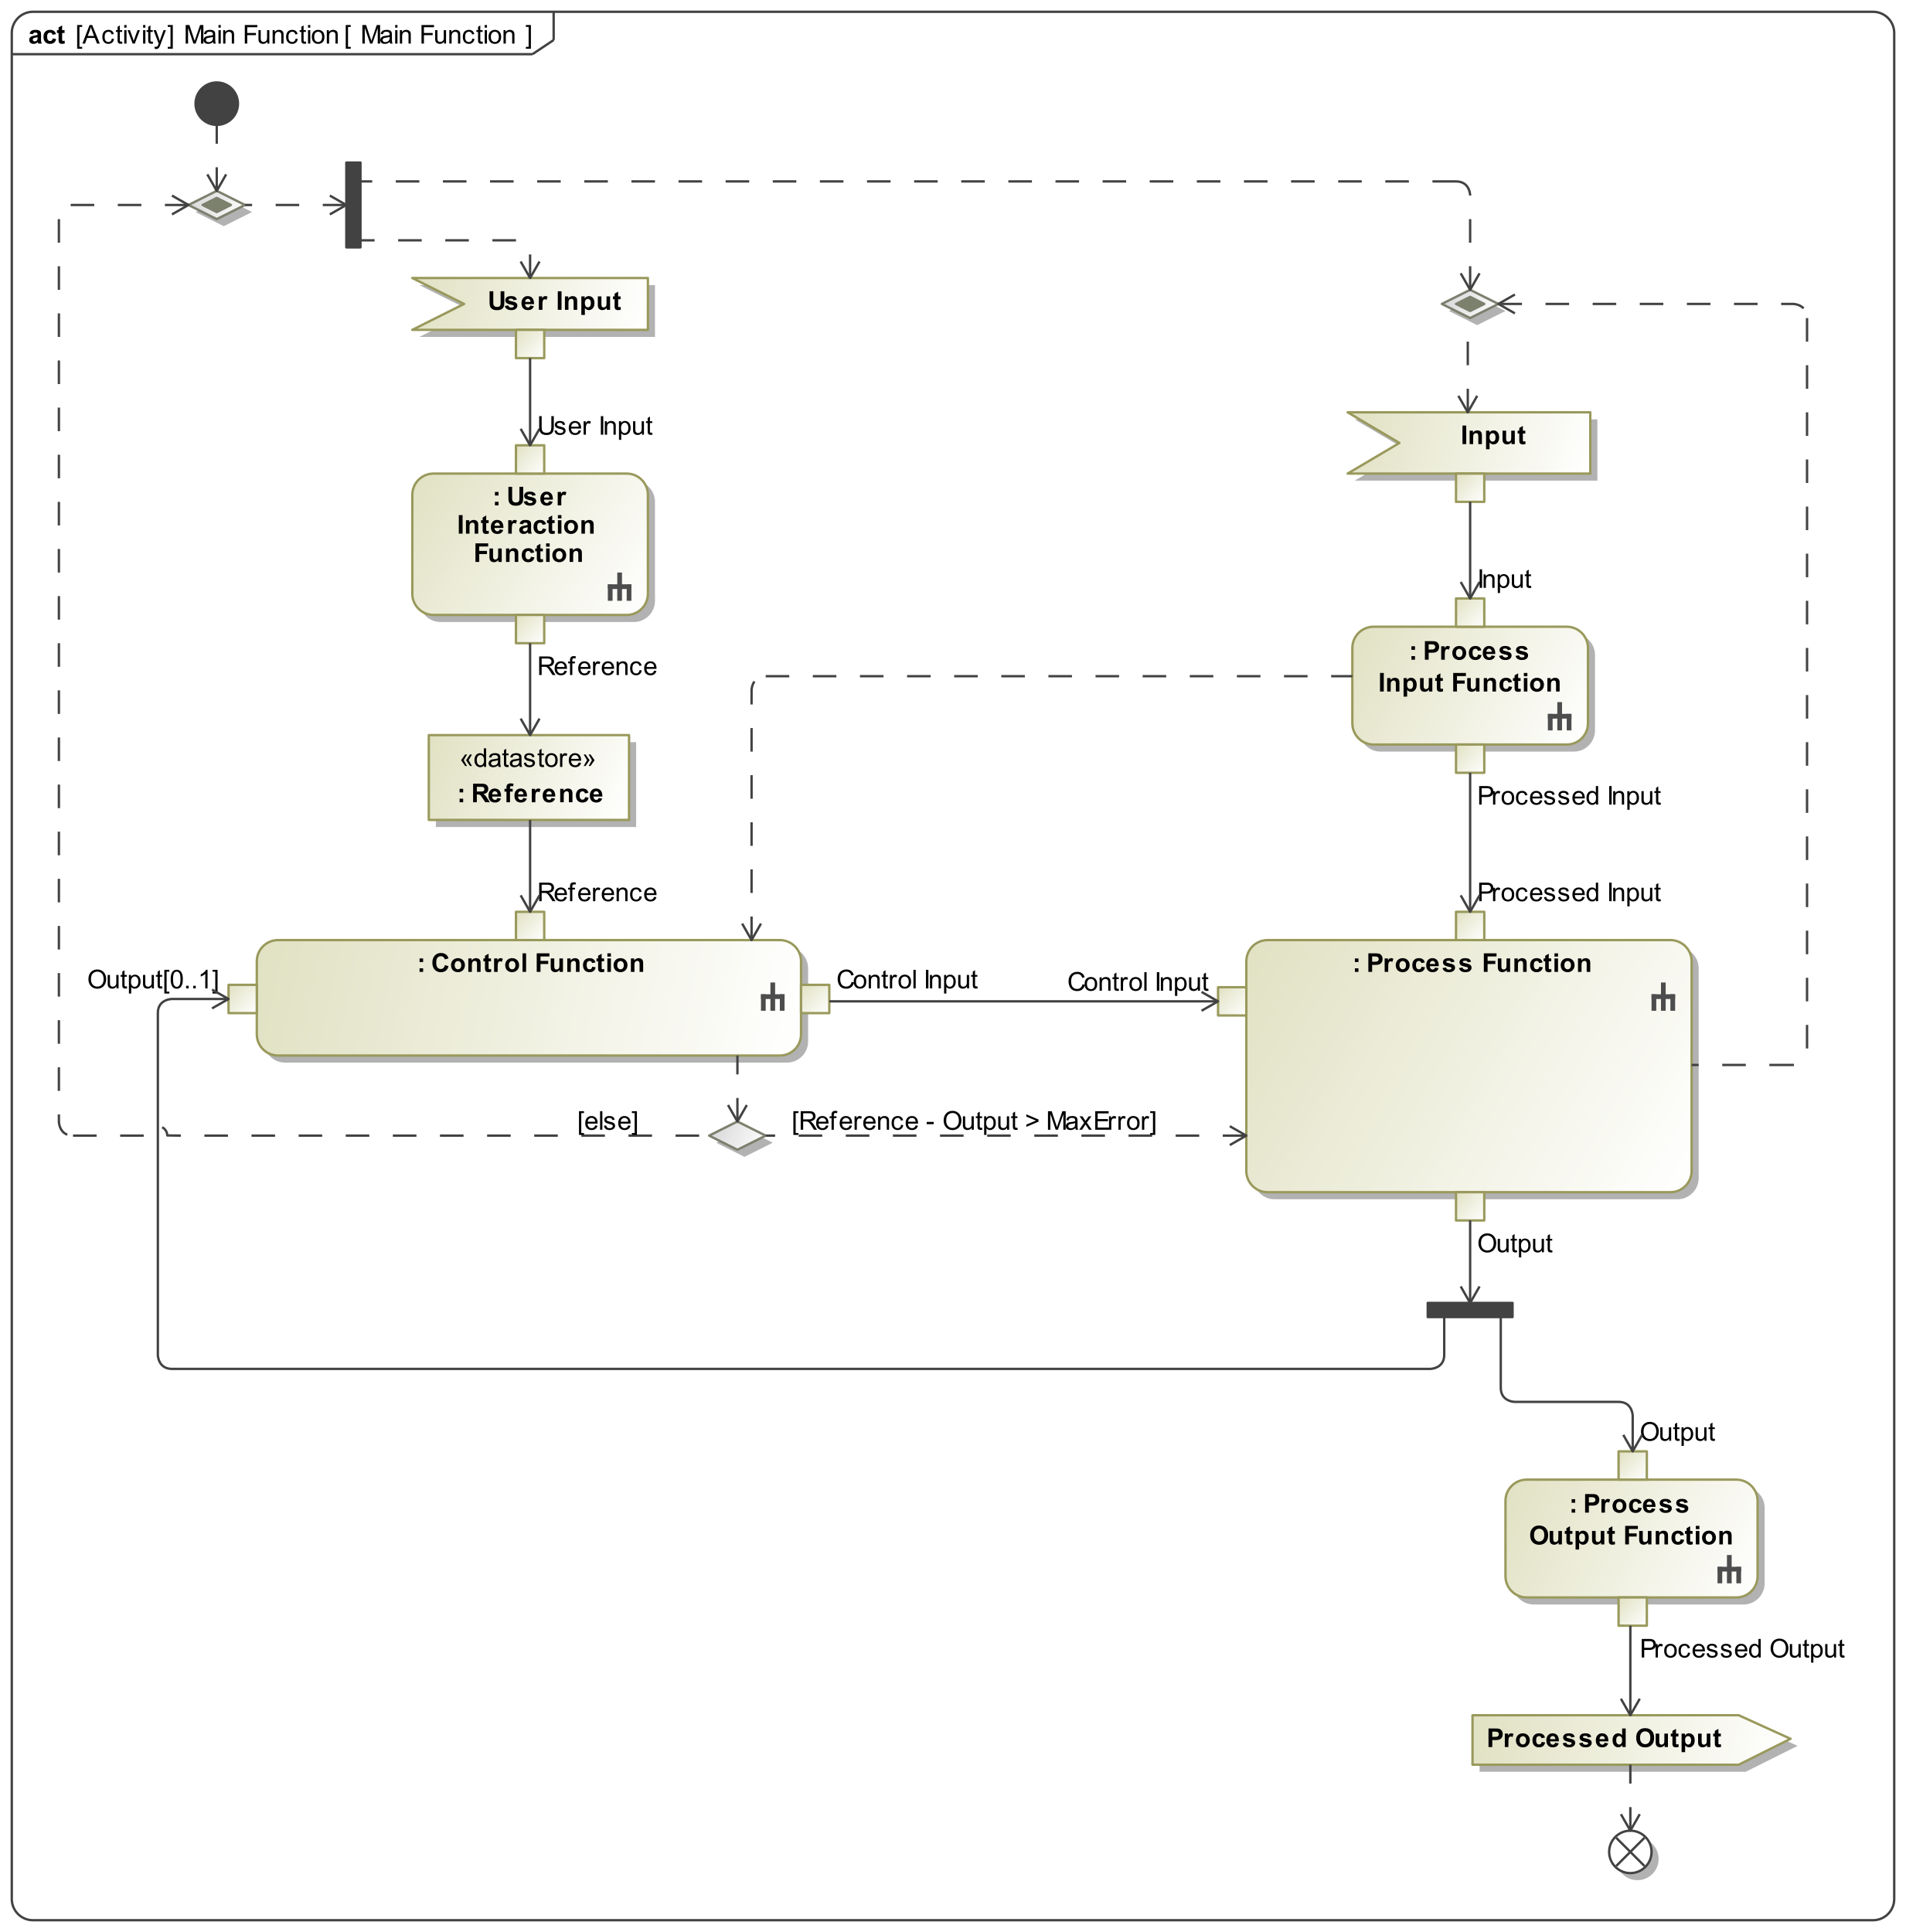
Figure 32. Functional flow after adding the control flow and fixing simulation errors
The final activity diagram for the EPBS is shown in Figure 33.
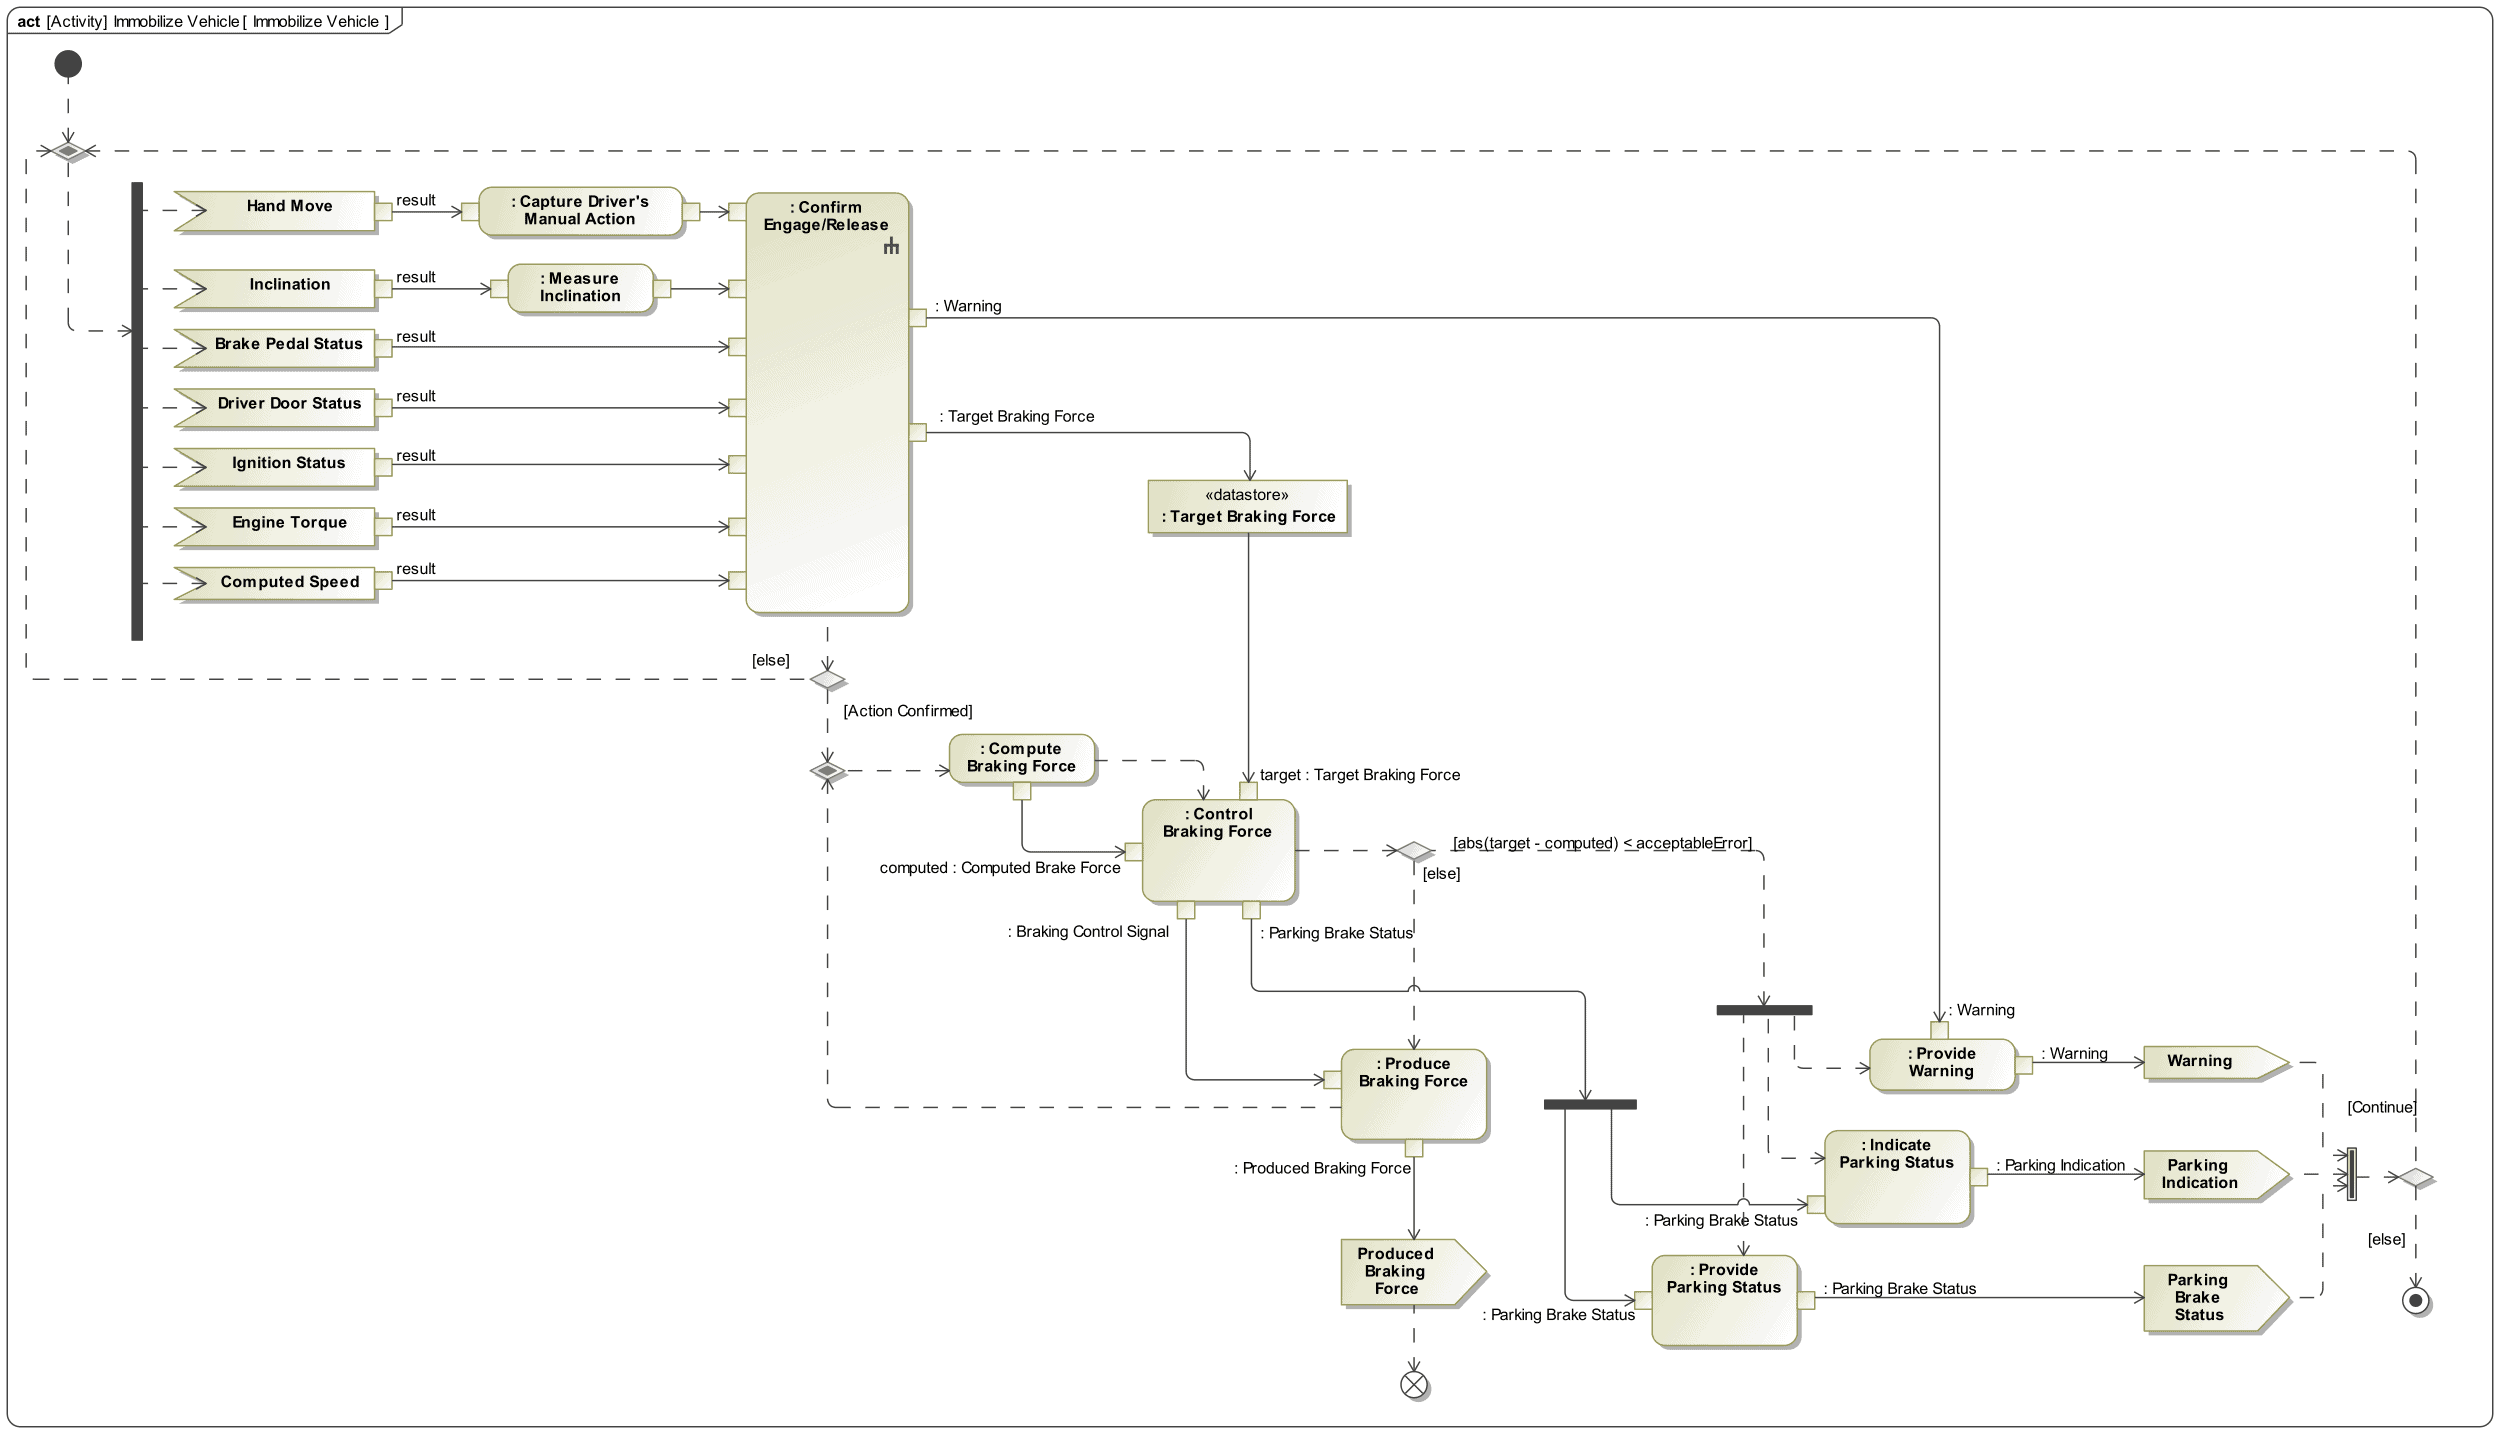
Figure 33. Functional flows including control for immobilizing the vehicle
Finally, if we return to the N², we will see that the N² was modified and some flows are lost (Figure 34) after adding data stores and other nodes that were added to validate the behavior. To recover them, we need to add metachain navigations to the dependency criteria section of the dependency matrix (Figure 37). Metachain navigation is an operation type of the Cameo tool that allows searching for the indirectly related elements, i.e. those output and input pins of actions that are connected through object flows, but interrupted by data stores or other kind of nodes (e.g. forks).
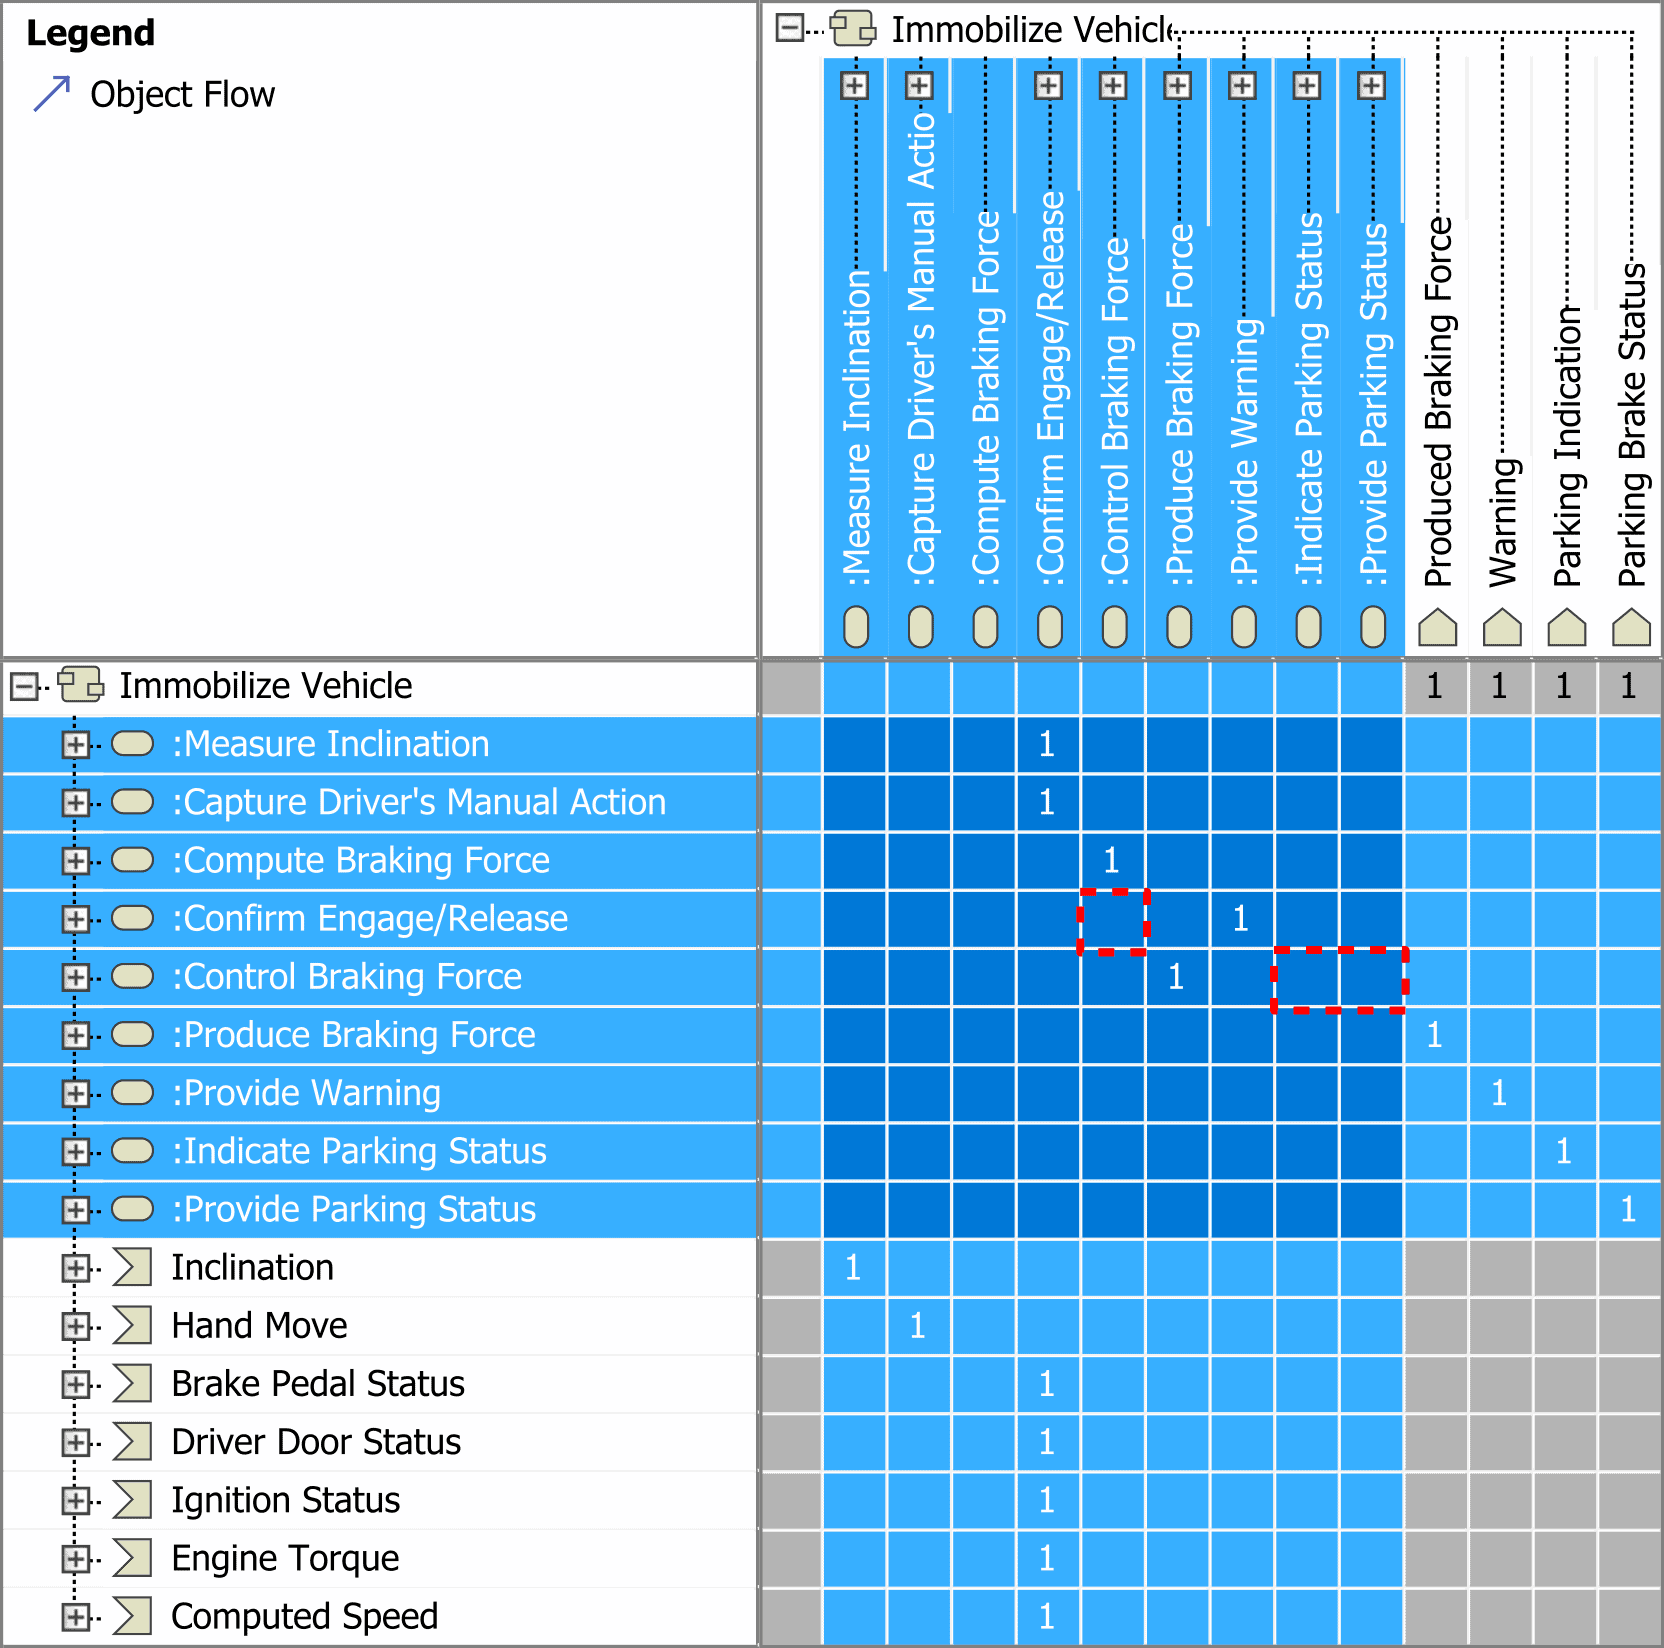
Figure 34. N² without metachains in the Dependency Criteria
Figure 35 shows the metachains for pins connected thorough a decision node (left) and a «data store» node (right), respectively.
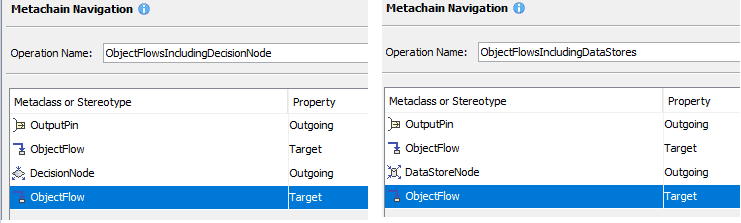
Figure 35. Metachains must be added to the Dependency Criteria field
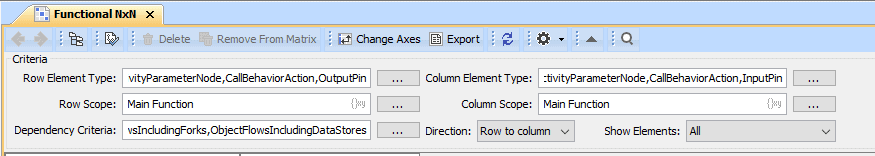
Figure 36. Dependency matrix including metachains in the Dependency Criteria field
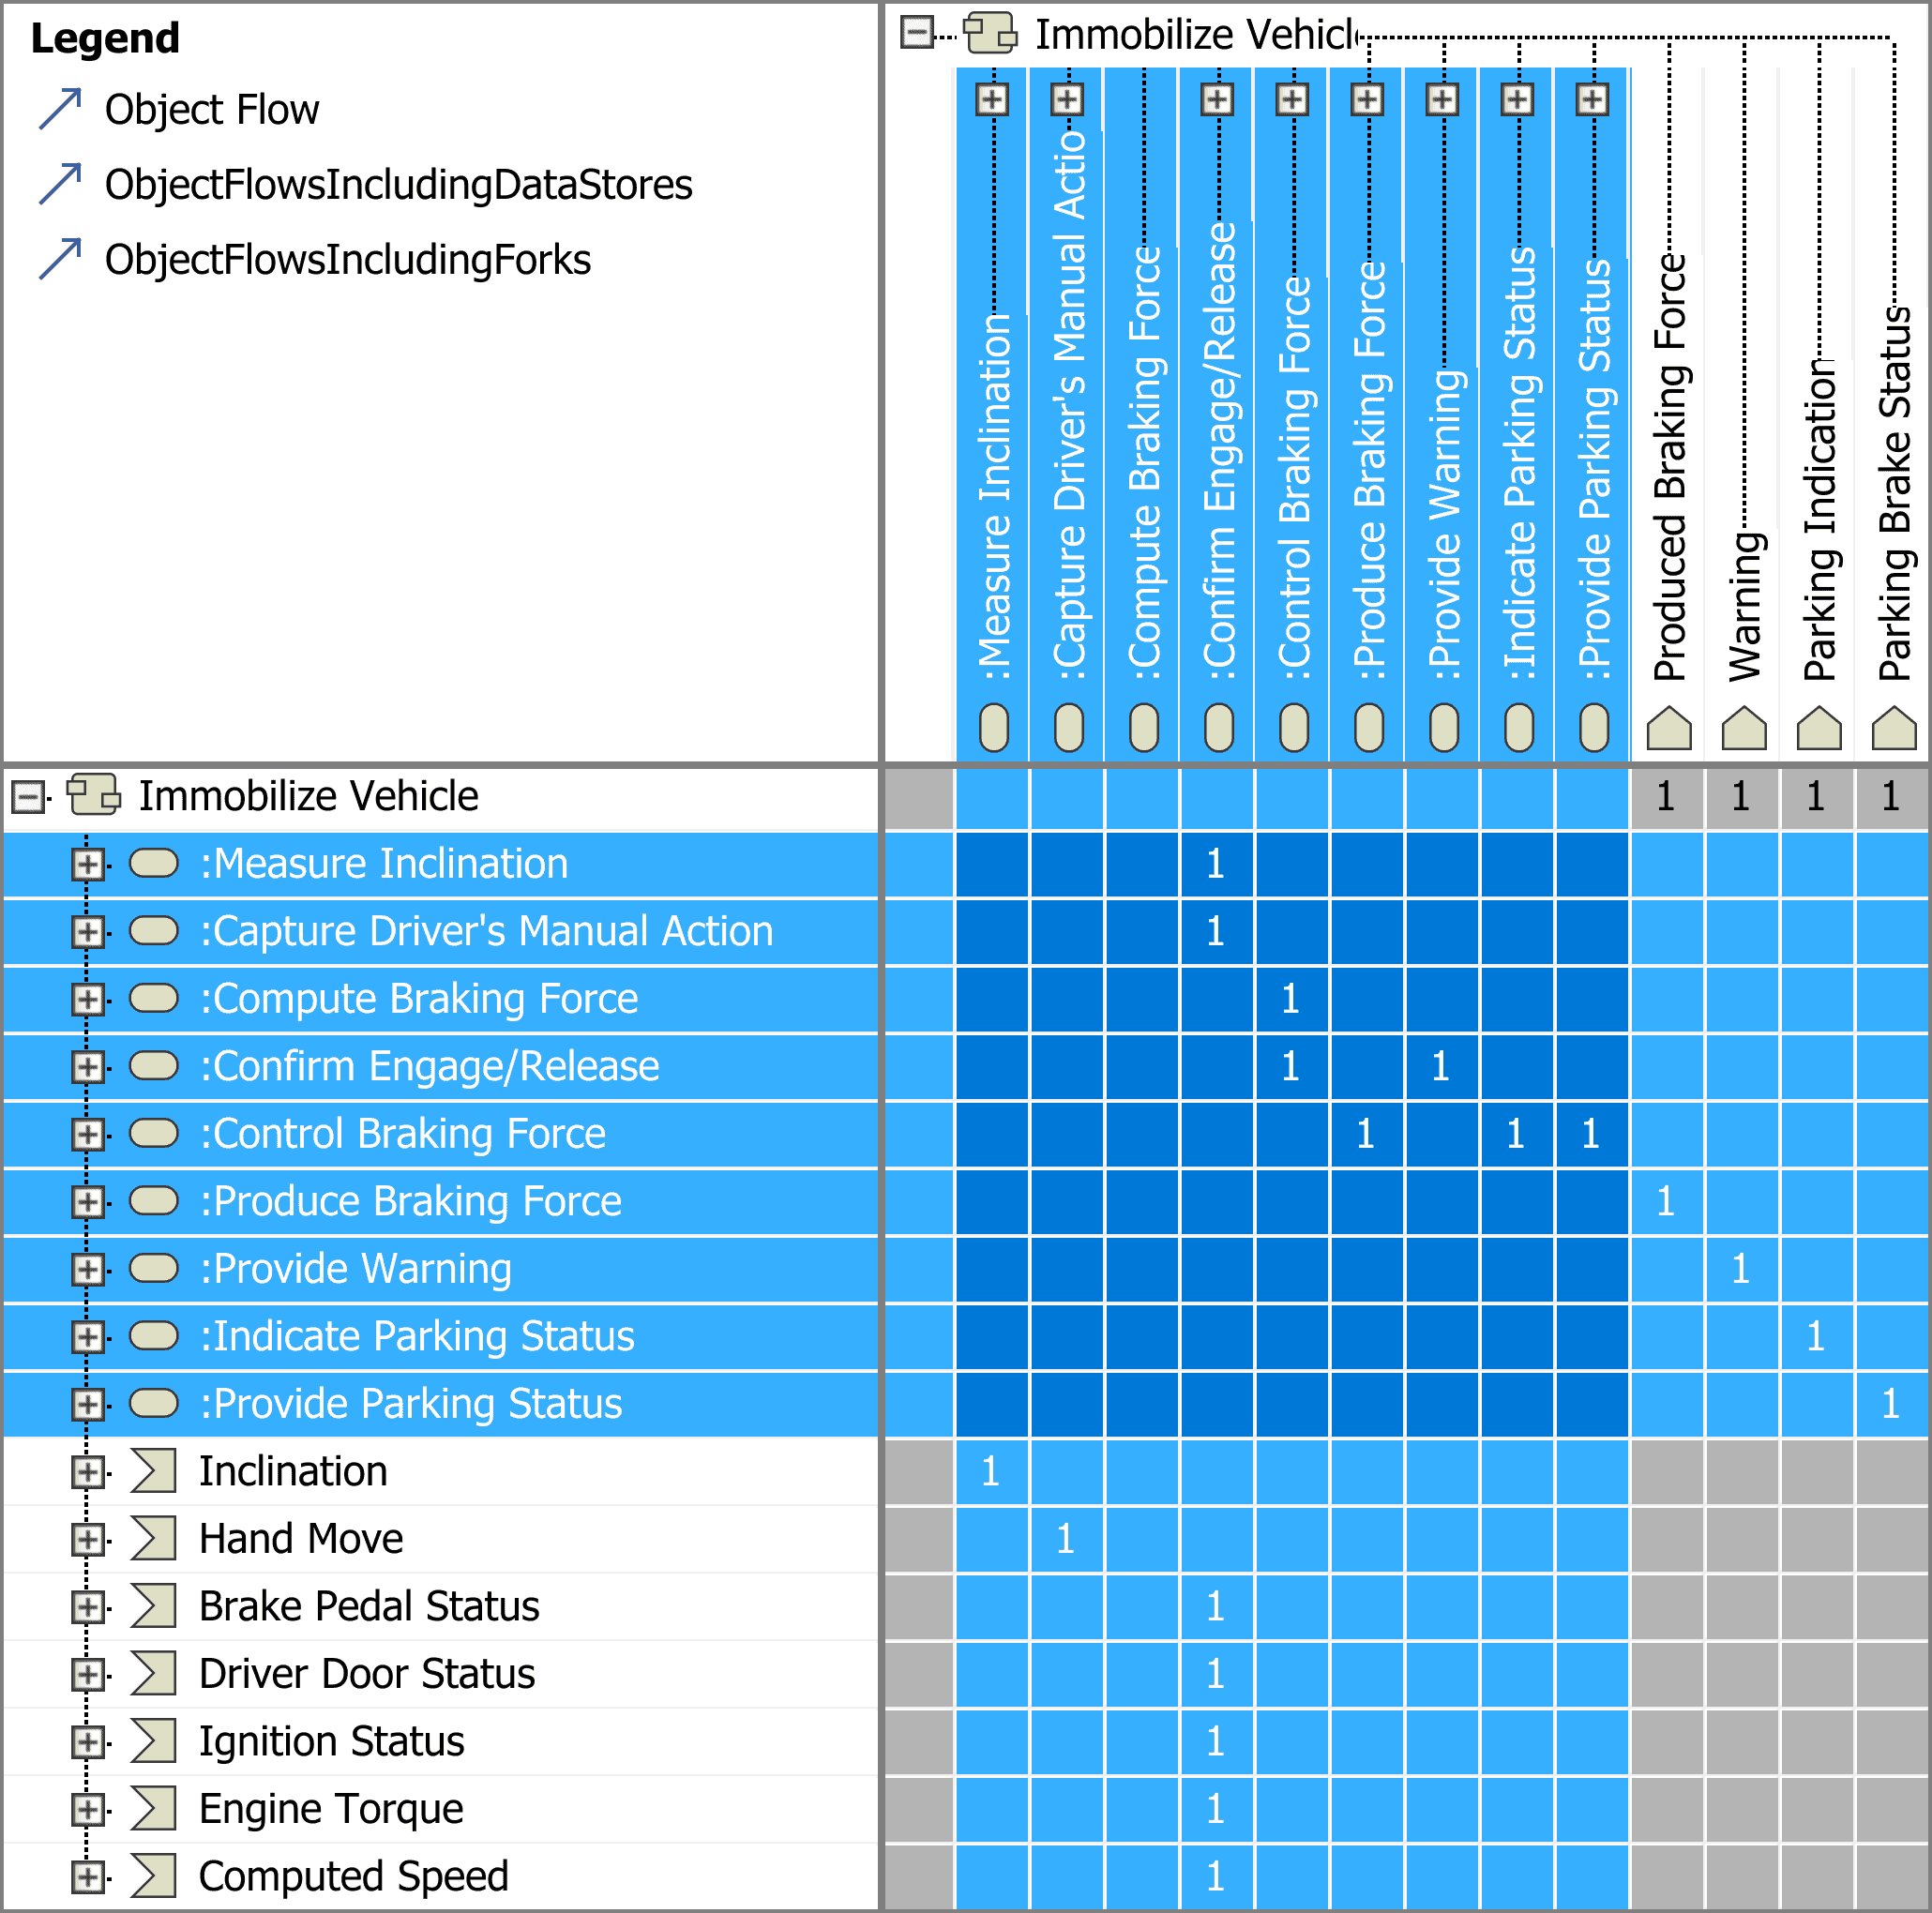
Figure 37. N² recovers the dependencies after adding the metachains
Summary and Conclusions
Along the paper we have shown how to apply the ISE & PPOOA methodological approach using the Cameo System Modeler tool to define the functional architecture of an electric park brake system. This is an easy and effective way to create functional architectures which are understood, validated by simulation, and consistent with the system capabilities, operational scenarios, and context to deliver value to the stakeholders. Using the functional hierarchy and the N² matrix (i.e. functional interfaces), we can create the functional flows (i.e. the system behavior) semi-automatically using the tool, which will be consistent with the functional tree and the N² chart.
Additionally, as this is an iterative process, the approach helps clarify the intended system operations and system requirements, so that the customer’s voice is recorded and understood by developing team.
Once we have a good definition of the problem given by the produced assets (N² and functional flows), we are in a great position to start to define the solution (initial physical concepts to see how we can realize the define functions, and a refined physical architecture) that will satisfy the customer´s expectations.
List of Acronyms Used in this Paper
Acronym Explanation
DoDAF Department of Defense Architecture Framework
DSM Design Structure Matrix
EPBS Electric Parking Brake System
INCOSE International Council on Systems Engineering
ISE&PPOOA Integrated Systems Engineering & Pipelines of Processes in Object-Oriented Architectures
MBSE Model-Based Systems Engineering
NIST National Institute of Standards and Technology
SysML Systems Modeling Language
US DoD U.S. Department of Defense
References
- R.S. Carson and B.J. Sheeley. Functional Architecture as the Core of Model-Based Systems Engineering. Proc. INCOSE International Symposium, Vol. 23, 2013, pages 29-45.
- J.L. Fernandez and C. Hernandez. Practical Model-Based Systems Engineering. Artech House 2019.
- D.K. Hitchins. Advanced Systems Thinking, Engineering and Management. Artech House, 2003.
- C. Bock. SysML and UML 2 Support for Activity Modeling. Systems Engineering, Vol. 9, No. 2, 2006.
- D.J. Hatley, and I. A. Pirbhay, Strategies for Real-Time System Specification, New York: Dorset House, 1988.
- E. Crawley, B. Cameron, and D. Silva. System Architecture: Strategy and Product Development for Complex Systems. Pearson Higher Education 2016.
- INCOSE. Systems Engineering Handbook: A Guide for System Life Cycle Processes and Activities. John Wiley & Sons, 2015.
- DoD Deputy Chief Information Officer. DoDAF Architecture Framework Version 2.02. Department of Defense, 2010.
- C. S. Wasson. System Analysis, Design, and Development. Concept, Principles, and Practices. John Wiley & Sons, 2006.
- INCOSE. Framework for the Application of Systems Engineering in the Commercial Aircraft Domain. International Council on Systems Engineering (INCOSE), 2000.
- J.M. Hirtz, et al. Evolving Functional Basis for Engineering Design. Proc. ASME Design Engineering Technical Conference, Pittsburgh, PA, September 9–12, 2001.
- Dennis M. Buede, The Engineering Design of Systems: Models and Methods. John Wiley & Sons, 2009.
- R. Stevens, et al. Systems Engineering. Coping with Complexity. Prentice Hall Europe, 1998.
- D.A. Gebala, and S.D. Eppinger. Methods for Analyzing Design Procedures. De-Vol. 31, Design Theory and Methodology ASME, 1991)
About the Authors

Alfonso Garcia is an independent systems engineering consultant. He has a master’s degree in Industrial Engineering (Automation and Electronics) from Univer Politécnica de Madrid and he has been an INCOSE Certified Systems Engineer Professional (CSEP) since 2014. He has more than 13 years of professional experience as a systems engineer, architect, and consultant, and he was involved in different engineering projects, including air traffic management, avionics, automotive, and elevation systems, using both classic systems engineering and MBSE.

Jose L. Fernandez has a PhD in Computer Science, and an Engineering Degree in Aeronautical Engineering, both from Universidad Politécnica de Madrid. He has over 30 years of experience in industry as system engineer, project leader, researcher, department manager, and consultant. He was involved in projects dealing with software development and maintenance of large systems, specifically real-time systems for air traffic control, power plants Supervisory Control and Data Acquisition (SCADA), avionics, and cellular phone applications. He was associate professor at the E.T.S. Ingenieros Industriales, Universidad Politécnica de Madrid (UPM). He is the methodologist of the PPOOA architectural framework for real-time systems and ISE&PPOOA, an integrated systems and software MBSE methodology for complex systems. He is senior member of the IEEE (Institute of Electric and Electronics Engineering) and member of INCOSE (International Council on Systems Engineering), participating in the software engineering body of knowledge, systems engineering body of knowledge, and requirements engineering working groups of these associations. He is a member of the PMI (Project Management Institute) participating as reviewer of the PMBoK 6th Edition, 2017, and the Requirements Management Practice Guide, 2016.
3. ADDITIONAL ARTICLES
3.1 An Economic Analysis of Software Defect Removal Methods
by
Gary A. Gack
Email: g.gack.fl@gmail.com
January 25, 2021
Abstract
This paper, based on my book Managing the “Black Hole”: The Executive’s Guide to Software Project Risk, explores the economic and delivered quality consequences of alternative strategies for software defect detection and correction during the software development life cycle. The model described here is an evolution of the one discussed in my book. Values derived in this version vary somewhat from those included in the book. The updated version of the model is generally consistent with the earlier version and leads to the same conclusions – the main difference has to do with the ease of use and a few small changes otherwise.
Copyright © 2021 by Gary A. Gack. All rights reserved.
Introduction
It is widely recognized that software projects are prone to substantial cost and schedule overruns as well as poor delivered quality. In large part these undesirable outcomes are a consequence of inadequate planning practices, frequently exacerbated by misleading in-process status reporting.
To use a medical analogy, software project “health” is frequently measured today using a set of relatively primitive metrics analogous to vital signs (blood pressure, temperature, etc.) supplemented, perhaps, by x-rays. This paper explores use of more advanced metrics, possibly analogous to CAT scans and MRI.
These models are available from the author on request, subject only to a good faith agreement to share assumptions and conclusions.
Objectives
This paper (and the models it describes) is intended to help software organizations find an optimal combination of defect containment methods and resource allocation. “Optimal” ideally means:
- Minimization of Non-Value-Added (NVA) costs, i.e., the sum of Appraisal and Rework, both pre- and post-release.
- Maximization of delivered quality, measured by Total Containment Effectiveness (TCE), the percentage of defects removed prior to delivery.
These models provide a mechanism to forecast the consequences of alternative assumptions and strategies in terms of both cost (in person months) and delivered quality, measured by TCE.
Caution
As George Box said, “All models are wrong – some are useful.” The model described here uses parameters taken from a variety of public sources, but makes no claim that these parameter values are valid or correct in any particular situation. I encourage anyone interested in using this model to first study the model carefully to understand the logic it embodies before attempting to apply it in a given situation. It is hoped the reader will take away a thought process and perhaps make use of this or similar models using parameter values appropriate and realistic in the intended context.
It is widely recognized that all software benchmark values are subject to large (and typically unstated) variation. Many parameter values will change significantly as a function of project size, application domain and other factors.
Overview
The complete model, implemented in Excel, includes 6 tabs – the first tab includes all required parameters, initially populated with a “starter set” of values taken from various public sources. These parameters may be changed to reflect any desired scenarios as exemplified by scenarios 1, 2, and 3 described below. The next 4 tabs utilize these parameters to calculate various values of interest, shown as shaded columns. The sixth tab summarizes the results of the previous four. We will look at the summary first, and then get into the details upon which the summary is based.
Scenario 1 represents a “test only” scenario in which no “pre-test” appraisals, such as formal inspections, are used. Scenarios two and three introduce certain pre-test appraisals, including inspections and static analysis, and discontinue some test activities.
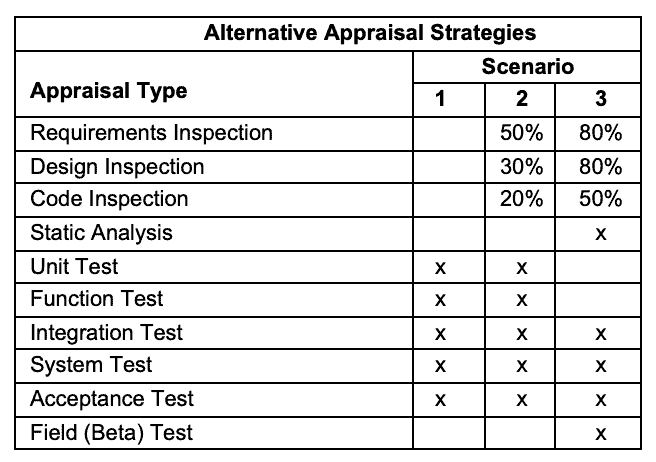
Note that static analysis can only be used for certain procedural languages such as C and Java.
Data from the summary, displayed below, include three scenarios all based on an assumed project size of 1000 function points. All three scenarios assume defects are “inserted” at US average rates according to Capers Jones Software Engineering Best Practices (2009, p.69) – a total of approximately 5.00 defects per function point, including bad fixes and documentation errors.
The table below summarizes the results the model produces when parameters expressing these three scenarios are used. The “starter set” model and all of these scenario versions are available for your review and use on request.
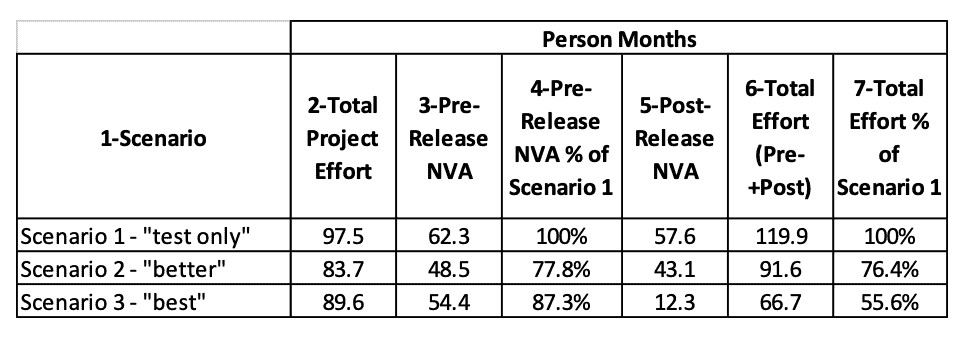
Two graphical summaries are provided below – the first shows the impact of alternative appraisal strategies on delivered quality as measured by “Total Containment Effectiveness”. In this illustration delivered TCE improves from 80.5% in a test-only approach (scenario 1), typically used by average groups, to 95.9% in a “best” mix of appraisal activities (scenario 3) used by some more mature groups. This dramatic improvement in delivered quality surely leads to much higher customer satisfaction.
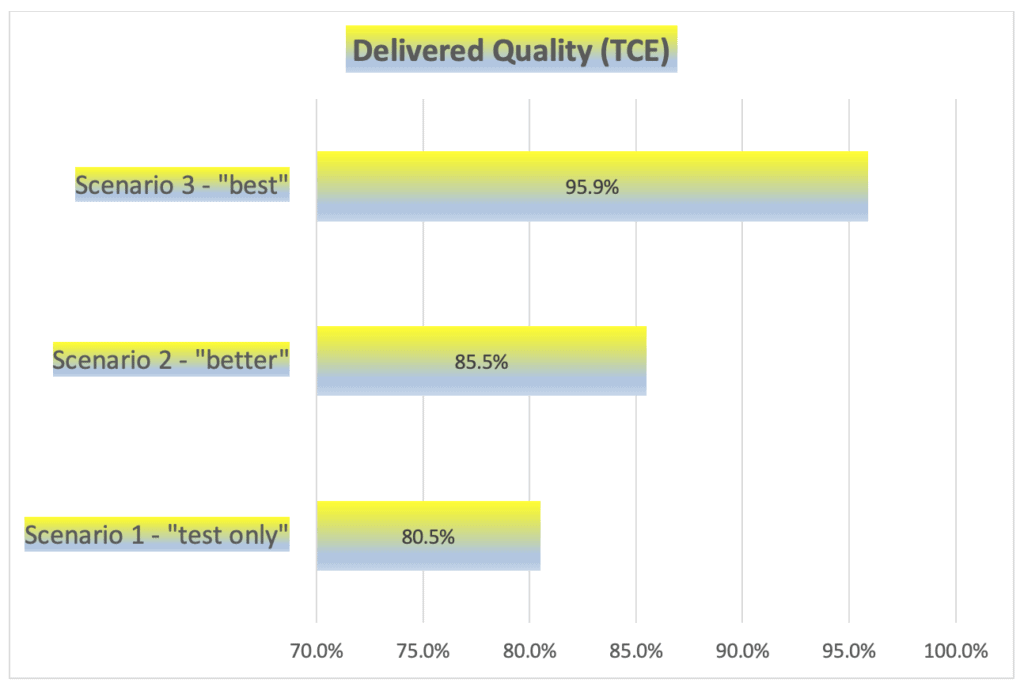
The second summary shows the impact of alternative appraisal strategies on “non-value-added” effort as defined in the Cost of Quality framework – i.e., all appraisal and rework effort is by definition “non-value-added” (NVA). Although certainly a “necessary evil” our goal will always be to minimize these costs.
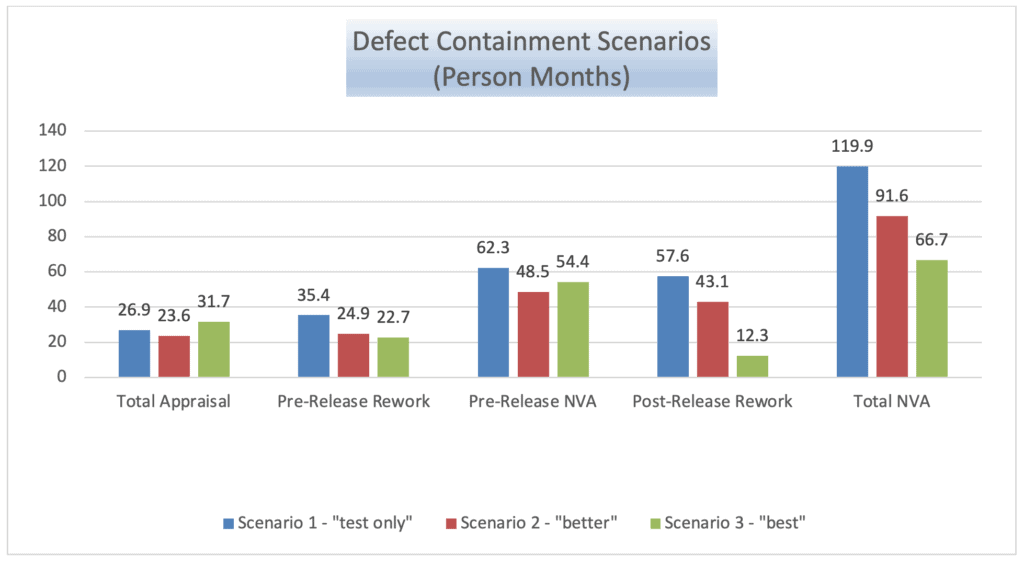
In this illustration a “best” mix of appraisal activities (scenario 3) reduces total NVA effort (including both pre- and post-release effort) by 44.4% compared to a test-only approach typically used by average groups (66.7-person months in scenario 3 vs. 119.9 in scenario 1). Pre-release NVA is reduced by 12.7%.
Supporting Details
As indicated earlier, the first tab (“ReqdParameters”) contains various parameters that are used to develop the calculations in the other tables.
- Tab 2: “Table1-DefectContain” – identifies appraisal steps to be used in a given scenario, a forecast of the number of major defects likely to be present at the start of each appraisal step, and the “containment rate” (expected percentage of defects likely to be found) for each step. The model forecasts total major defects found and remaining at each appraisal step based on the parameters provided.
- Tab 3: “Table2-InspectionEffort” – parameters define the percent of the total work product to be inspected (often less than 100%), the number of major defects expected to be found by each inspection type, and the estimated rework hours per defect per inspection type. Forecasts of number of inspections, inspection effort, and rework effort for each step are derived from the parameters provided and from data derived in table 1.
- Tab 4: “Table3-StaticEffort” – required parameters include a forecast of effort hours per size and rework hours per major defect. Total analysis effort and rework effort are calculated.
- Tab 5: “Table4-TestEffort” – parameters include effort per size for each test step, a factor that reflects the impact of pre-test appraisals (if any), and rework hours per major defect for each test step. Total test execution and rework effort are calculated for each test step.
- Tab 6: “ForecastResultSummary” – recaps the values derived in Tables 1-4.
Each of these tables is described below and the sources of the parameter values used are identified. The parameter values in the “starter set” may or may not be appropriate to a particular context. Sources of and rationale for “starter set” parameter values are introduced as they are used in Tables 1 through 4, even though they are entered in Tab 1 and “paste linked” to tables 1 through 4. I encourage readers to share any data and/or opinions they may have regarding these parameter values. A summary of feedback I receive will be available to participating parties.
Table 1: The Defect Containment Model
This “starter set” assumes all appraisals are used – this is not a realistic scenario for most situations, except perhaps some high reliability applications, in which case higher % Inspected and ACE% are likely. This complete list is necessary to fully populate the model to accommodate any desired combination of appraisals as appropriate for any desired scenario.
Table 1: The Defect Containment Model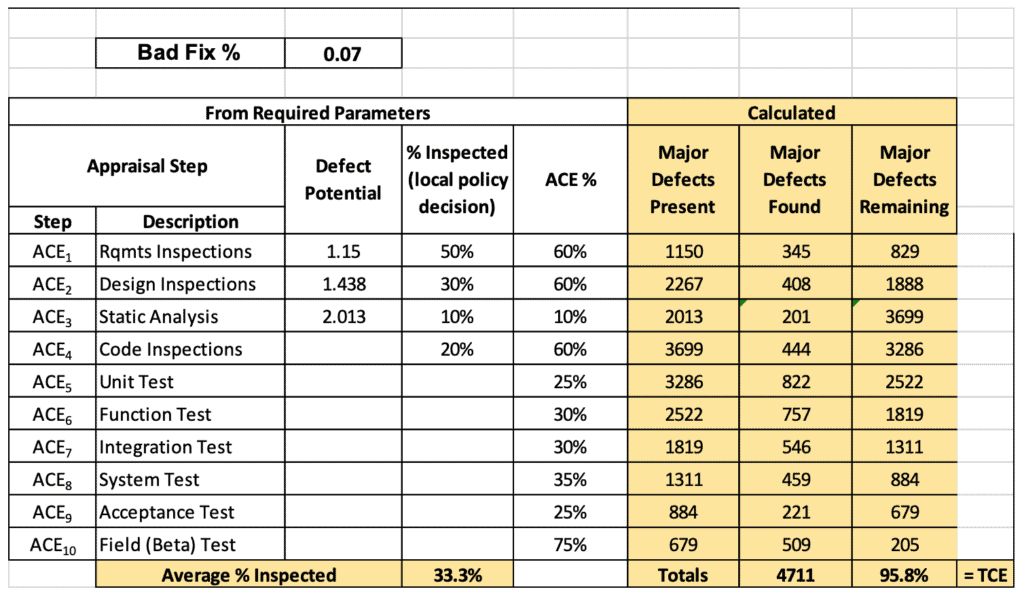
Planned vs. actual appraisal effort to date and planned vs. actual major defects found enable “quality adjusted” status reporting. Stephen Kan has suggested combining these data in a matrix format as adapted here:
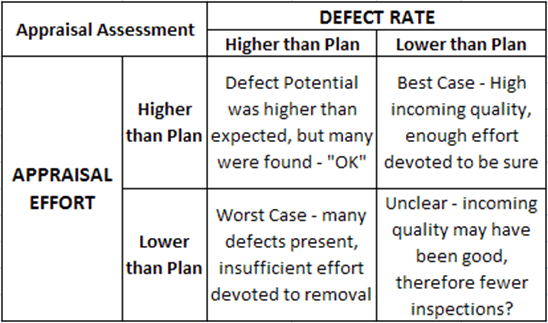
Column 1 – Each row is “tagged” by an identifier in the form “ACEn” where ACE stands for “Appraisal Containment Effectiveness” and the subscript uniquely identifies a specific appraisal step or type.
Column 2 – Appraisal steps to be included in any given scenario are named. I have included a default list of commonly used appraisal steps, but these may be changed as appropriate to any particular situation. Additional rows might be added if required.
Column 3 – Defect Potential (defects per size “inserted”). The values used here are based on Jones2009[6], p.69. I have adjusted his values by allocating documentation defects proportionately to requirements, design, and code.
Column 4 – % Inspected. Use of % Inspected rests on the assumption that we can intelligently select those portions of the work product most likely to contain major defects and will not need to inspect 100% of the product to find an acceptable portion of defects forecast to be “inserted”. It is generally accepted that “defect clustering” occurs – defects are not evenly distributed across the work product. Default assumptions are simply examples, but are entirely a local choice – so far as I am aware there are no benchmarks for these numbers. NOTE: ACE% and % inspected may interact – when less than 50% is inspected it is likely some un-inspected work products contain significant numbers of defects that will not be detected – hence I suggest using ACE 60% in those scenarios – as higher percentages are inspected the likelihood of defects not found declines, so therefore the ACE% is likely higher as per the 65-85% benchmark Capers suggests.
Column 5 – ACE % is an estimate of the percentage of incoming defects likely to be found by the indicated appraisal step. Jones (ibid, p.125) reports containment rates for inspections range from 65% to 85%. I have elected to use a more conservative starter value of 60% for inspections. I have assumed a conservative 10% containment rate for static analysis – Jones (ibid, p.615) indicates 87% – note that static analysis applies only to code (it does not find requirements or design defects) and also does not generally find functional defects – most defects found by static analysis are “syntactical” in nature. Test step containment rates are based on Jones2007 p.488 (Outsource). 0% indicates an appraisal type is not used.
Column 6 – Major Defects Present = Defect Potential * Size
Column 7 – Major Defects Found = Major defects Present * % Inspected * ACE%
Column 8 – Defects remaining (present less found, cumulative) are increased by 7% to reflect bad fixes at each step.
Average % Inspected (used later), Total Major Defects Found, and TCE are also calculated
Table 2: Inspection Effort Model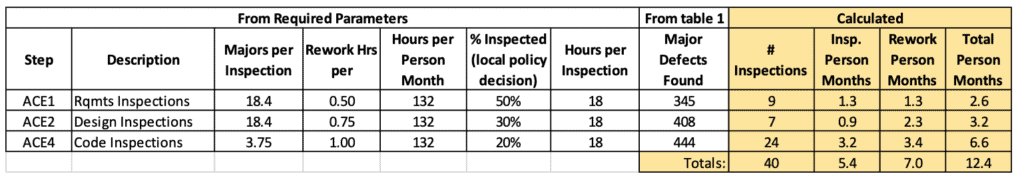
Columns 1 and 2 are the same as in table 1.
Column 3, Major Defects per Inspection, indicates an expected average number of major defects likely to be found by a single inspection event conducted in accordance with IEEE Std. 1028-2008. The values used in this illustration are based on a collection of approximately 1500 individual inspection records complied by the author from a variety of sources. These records indicate actual results achieved across several dozen different software groups in a range of industries. Where local data exist they should certainly be used.
Column 4, Rework hours per major defect, an additional parameter, is used to calculate total rework in person months. I have been unable to find satisfactory benchmark values for rework of defects found by inspections. Hence I use my own “guesstimates” based on experience. Jones and others have shown the classic “1-10-100” ratio of increasing defect costs is clearly not correct. In my experience cost to fix a defect does increase through the life cycle, but only slowly. Again, these parameters are best locally determined.
Column 5, Hours per Person Month reflects local practice
Column 6 specifies the percent of the total work product inspected. My experience suggests wide variation, and I do not believe any particular benchmark is relevant. This value is a local policy decision based on product risk characteristics and other factors.
Column 7 indicates average hours per inspection – this value reflects practice consistent with IEEE 1028-2008.
Column 8 is Major Defects Found from Table 1
Column 9, number of inspections, is calculated as follows:
# Inspections = [# Major defects Found (from table 1) / (majors per inspection)] * (% inspected) – the logic of this calculation rests on the assumption that we can intelligently select those portions of the work product most likely to contain major defects and will not need to inspect 100% of the product to find the number of defects forecast. It is generally accepted that “defect clustering” occurs – defects are not evenly distributed across the work product. Caution – this logic can be misleading if an aggressive containment rate is used in table 1.
Column 10, Inspection person months, is calculated as [number of inspections * 18 hours per inspection] (consistent with IEEE 1028-2008, excluding rework calculated separately), divided by person hours per month to arrive at person months of inspection effort.
Column 11, Rework Person Months = (# Major Defects * Rework Hrs per) / hours per person month
Column 12, Total Person Months = Col. 10 + Col. 11
This “starter set” scenario shows the indicated sequence of three types of inspections will require 5.4-person months to conduct a total of 40 inspections and an additional 7-person months of effort to correct the defects forecast to be found by inspections (from table 1). Inspection effort may be regarded as a “fixed” cost in that once a decision has been made to conduct the inspections the necessary effort will be incurred regardless of the number of defects actually found. Rework effort to correct defects actually found is a variable cost.
Table 3: Static Analysis Effort Model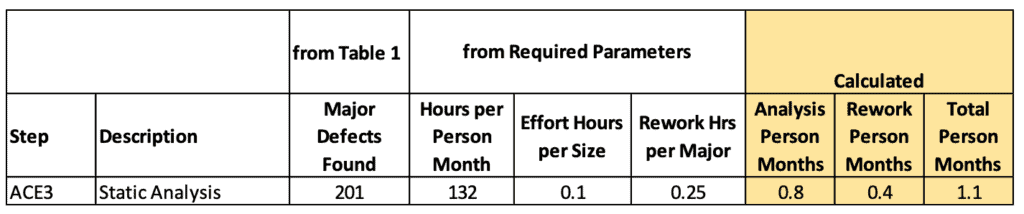
Columns 1 and 2 are as in table 1.
Column 3, from Table 1, is the number of Major Defects Found
Columns 4, 5, and 6 are from Required Parameters
Column 7 calculates person months required to run static analysis and analyze the results. = (column 3 * size) / person hours per month = .8-person months in this example
Column 8 calculates rework person months = [major defects found (from table 1) * column 6] / col. 4.
Column 9 = Total Person Months (col. 7 + col. 8)
Table 4: Test Effort Model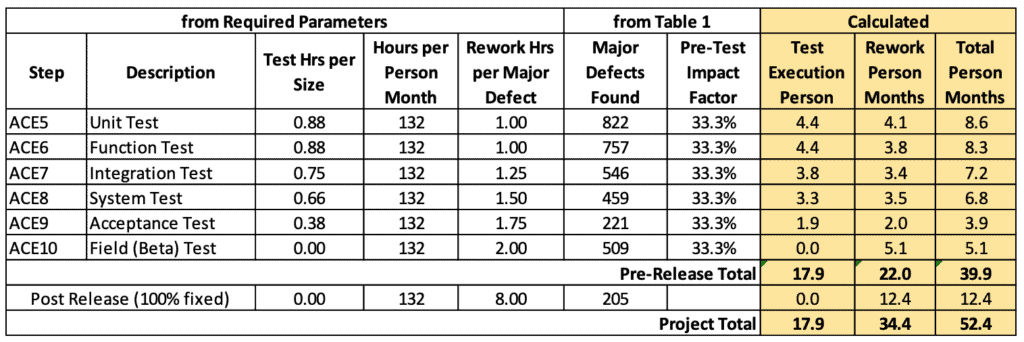
Columns 1 and 2 are as in table 1.
Column 3 specifies test hours per size. Values included here are based on Jones2009 (ibid, p.264, mode values)
Column 4 is hours per person month
Column 5 indicates rework hours per major defect. Values indicated are rough estimates based on my experience. The post-release value (8 hours per major defect) is based on a rough “average” of several different data points provided by Jones[7].
Column 6 is Major Defects Found from Table 1
Column 7 is a “Pre-Test Impact Factor”, also from Table 1. I have elected to use Average % Inspected from table 1 as a reasonable approximation of this effect. When pre-test methods are used there are several important consequences that impact test effort:
- The number of defects coming into any given test step will necessarily be significantly fewer.
- Hence, fewer defects will be found, and less rework will be needed to correct those defects. “Variable” cost will go down.
- Fewer defects incoming means fewer tests will fail. When a test fails it will often prevent other tests from being executed – they are said to be “blocked”.
- Fewer defects incoming also means fewer tests will need to be re-executed to confirm the fix resolved the problem and did not cause unintended secondary effects.
- In total the length of the overall test cycle may be significantly shorter, resulting in a reduction in total labor cost required – “fixed” cost may also be less.
The Pre-Test Impact Factor is used to quantify the overall impact of these consequences – in effect this value indicates the % reduction expected for a given test step due to pre-test appraisals. The value may in some instances be 100% (1.0) if incoming quality is believed to be sufficiently good to simply not do certain types of tests (e.g., unit tests). If a test step is not used the ACE% for any such test step is set to zero in the Required Parameters tab. So far as I am aware no benchmark data on this parameter exist.
Column 8 calculates the effort (person months required to conduct each indicated type of testing) = [(test hours per size * size) / hours per person month] * column 4 (pre-test impact factor)
Column 9, total rework person months, = (defects found count from table 1 * Rework hrs per defect) / hours per person month.
Column 10 = col. 8 + col. 9
Pre- and Post-Release totals are also calculated.
Forecast Summary (using “Starter Set” parameters)
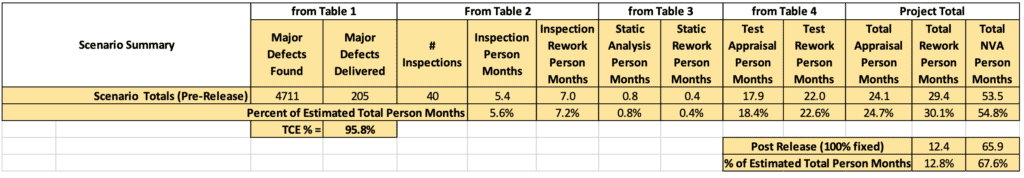
Sanity Check
Does all of this really make sense? How does this “simulation” compare to what we know about the real world? One way to evaluate the results of these models is to examine their conclusions in relation to total effort likely to be devoted to an actual project. Sanity checking any model is always a good idea. Experimenting with these models has shown that some published parameter values lead to totally implausible conclusions – e.g., pre-release NVA effort can exceed total project effort when some of these values are used. Obviously such a conclusion cannot be valid – at least one parameter value must be incorrect when the results do not make sense.
According to Jones2008 (ibid, p.295, table 3-29) an average 1,000 function point project will require about 97.5-person months of effort. The following table summarizes the results of the 3-scenario simulation, using the parameter values described above, to illustrate how those results relate to 97.5-person months of total effort.
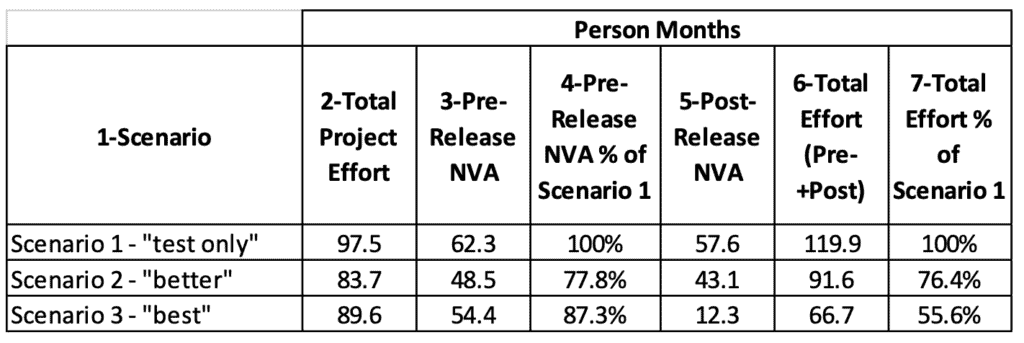
Column 1 identifies the scenario.
Column 2 assumes a “scenario 1” project requires 97.5-person months in total. Other scenario total effort requirements are reduced to reflect savings in pre-release NVA effort indicated in column 3 as a consequence of the appraisal strategies used in each.
Column 4 gives the percent of pre-release NVA effort for each scenario relative to scenario 1. As we see, scenario 3 results in a 12.7% reduction in total pre-release effort vs. scenario 1.
Column 5 indicates post-release NVA effort. We see that scenario 1 post-release NVA effort (57.6 person months) is nearly as large as NVA effort pre-release (62.3 person months). The real cost of this project is nearly 100% greater than the cost measured at the time of release – i.e., the total cost of the project is about double the original estimate. Very few low maturity organizations ever measure this and quite likely are in denial, but in my experience this appears to be very realistic.
Scenario 3, which introduces extensive inspections in addition to less testing than is included in scenario 1, has significant impact on both pre- and post-release NVA, and reduces total NVA by 44.4%. This appears to be highly consistent with results reported by high maturity organizations. Perhaps the fact that the largest part of the total benefit is post-release may explain why so many organizations try inspections but do not sustain them – the total savings are not evident at the time of release, and the largest part of the benefit may in any case be in someone else’s budget!
Column 6 is total effort pre- plus post-release – i.e., the sum of column 3 (total pre-release NVA effort) and column 5 (post-release effort, which is all rework and hence all NVA). As indicated in column 7, scenario 3 saves 44.4% relative to scenario 1.
Try this out with your own data or assumptions – I look forward to your feedback! For a copy of the model, please send me an email – g.gack.fl@gmail.com
List of Terms/Acronyms Used in this Paper
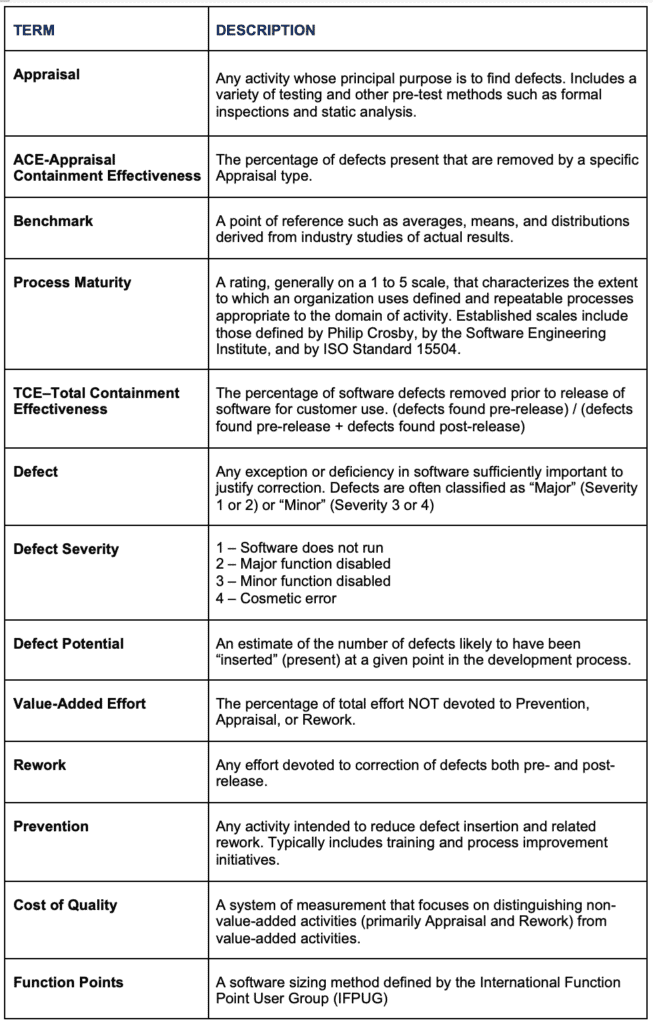
References
Capers Jones:
Software Engineering Best Practices: Lessons from Successful Projects in the Top Companies, McGraw-Hill (2009), ISBN-13: 978-0071621618
Applied Software Measurement 3rd Ed., McGraw-Hill (2008) ISBN 978-0-07-150244-3
Estimating Software Costs 2nd Ed., McGraw-Hill (2007) ISBN-13: 978-0-07-148300-1
Assessment and Control of Software Risks Prentice Hall (1994) ISBN 0-13-741406-4
Gary Gack, Managing the Black Hole: The Executive’s Guide to Software Project Risk Business Expert Publishing (2010) ISBN-10: 1-935602-01-2
Karl Wiegers, Peer Reviews in Software, Addison Wesley (2002) ISBN0-201-73485-0
Larry Putnam and Ware Myers, Five Core Metrics, Dorset House (2003), ISBN 0-932633-55-2
Ron Radice, High Quality Low Cost Software Inspections, Paradoxicon (2002) ISBN 0-9645913-1-6
Stephen Kan, Metrics and Models in Software Quality Engineering, 2nd Ed., Addison Wesley (2003) ISBN 0-201-72915-6
Tarek Abdel-Hamid and Stuart Madnick, Software Project Dynamics Prentice Hall (1991) ISBN 0-13-822040-9
About the Author

Gary A. Gack
Education and Credentials
MBA, The Wharton School, 1986; Six Sigma Black Belt, ASQ Certified Software Quality Engineer, PMI Project Management Professional, Certified Scrum Master, ITIL Foundation Certification
Work History (50+ years in software/IT, beginning in 1962)
2014 – Present: semi-retired, occasional informal consultant
2007 – 2014: self-employed independent consultant – Process-Fusion.net
Client engagements included:
- MBUSA Quality Evaluation Center – Six Sigma Green Belt training for 20 engineers – coached candidates for certification through team process improvement projects dealing with product quality operations.
- Broadridge Corp. – Six Sigma and software process best practices training for 16 software/IT professionals
- Ulticom – Six Sigma and software best practices, and formal inspections training and coaching for a team of approximately 20 software engineers and managers building telecom / VOIP software
- Gap, Inc. – problem project turnaround coaching and facilitation in support of the Real Estate department – performed an assessment to determine root causes of two prior failures, assisted them in reforming and re-motivating a joint business / IT team, aided them in vendor selection and team building. Facilitated requirements gathering and high level test planning.
- SAP Corporate (Waldorf, Germany) – lead and facilitated a process improvement assessment and planning activity in conjunction with the internal Six Sigma quality team
2003-2007: Partner, Six Sigma Advantage
Client engagements included:
- SAP (Waldorf, Germany) – Six Sigma Yellow Belt, Green Belt and Black Belt training for approximately 100 candidates in the corporate software quality organization. Provided training on software inspections and other software best practices. Coached Green and Black Belt candidates in execution of several dozen improvement projects required for certification.
- VF Corporation – performed an assessment of root causes of a “runaway” SAP deployment effort; facilitated re-planning for the project, resulting in a 10,000 task critical path network.
- Provided Six Sigma and software best practices training to software specialists in Motorola, IDX Software, SaraLee, Seagate, Trane, National City Bank, and others
1993 – 2002: self-employed independent consultant – IT Effectiveness, Inc.
Client engagements included:
- A variety of training, coaching and consulting engagements related to software and IT best practices in requirements, project management, methodologies, quality assurance, process improvement, and software metrics. Clients included VF Corporation, Rohm and Haas, Okidata, Bell Canada, Citizens Telecom, Mastercard, Cap Gemini, and others
6Jones, Capers, Software Engineering Best Practices, McGraw Hill 2009 ISBN 978-0-07-162161-8 ↑
7Approximately 6.6 hours per post-release defect may be derived from data provided in tables 9-13, 9-14, and 9-15 in Jones2009 (ibid. p. 596-599). 10 hours is suggested in Jones2008 Applied Software Measurement, 3rd Ed., p.485 ↑
3.2 Looking back: 2020 – The Year-In-Review – and Looking forward: in 2021 Things WILL get Better!
by
Mark Evans
Past President, INCOSE Chesapeake Chapter

Editor’s Note: INCOSE’s Chapters do amazing things and provide fabulous opportunities for their members. The Chesapeake Chapter is an example of the creativity and resourcefulness that has strengthened INCOSE and provided unlimited opportunities for personal growth and development.
There have been a lot of year-end reviews in 2020; seemingly more than usual. The one comment that seems to be universal is this: whatever you say about it, however you analyze it, 2020 is a year no-one will forget.
And so, it is with Chesapeake and the systems engineering community. As bad as 2020 has been in some respects, there are a lot of things to reflect upon and celebrate.
The Chapter started out with another outstanding year in 2020, keeping up with our core objectives to serve the professional community by encouraging, promoting, and advancing the systems engineering discipline. We wanted to reach out and support STEM activities in the local area; and nurture the future generation of scientists, technologists, engineers, and mathematicians. When the COVID-19 pandemic hit, the Chapter had to creatively adjust to new ways of engaging individuals and addressing the limitations of no in-person meetings, no monthly dinners, and some initially awkwardly staged presentations. Gone was the direct support at science fairs, and the ability to bring together SE professionals to present and discuss key topics and areas of interest for the SE and STEM communities. The Chapter had to reassess all of our activities (including the twice-a-year events to recognize SE professionals and the volunteers, sponsors, and support organizations), and also had to perform trade-off and alternative solutions to continue our core objectives for this Chapter (Sort of like Systems Engineering?). Technology and creativity enabled the Chapter to continue our support to our membership, the SE professionals, and the expanding STEM community.
Our Chapter pivoted our efforts from in-person activities to virtual activities using ZOOM, YouTube, and streaming technology; and quickly adapted to be proactive in working with the STEM community on multiple levels. We included monthly newsletters; monthly professional presentations; job fair involvement and SE mentoring; student STEM activities; academic scholarships, education, and training; a consolidated awards & recognition ceremony; support to INCOSE International events (IS and IW); book reports; and two new book projects and blog posts concerning engineering topics. COVID-19 forced the Chapter to become creative and more focused on engaging with SE and STEM communities in a virtual world. It also turned out to teach us new ways to be successful with new adapted ways of doing business in this pandemic era. (Necessity is the mother of invention!) We’ve learned some new things along the way; and we’ll be introducing new ways to share ideas, network, and interact that might continue to show that more people will interact and participate if you make it easy and fun for them to do so.
In no particular order, I’d like to highlight some of the important accomplishments by the Board and by the Chapter:
Key activities and links are noted below as representative of the work accomplished. The artifacts submitted for the Chapter Circle Awards provide more in-depth information and documentation. And a word about the Circle Awards—every Chesapeake member enjoys the notoriety of being in a Chapter that is Platinum Awarded for the past 5 years, but every year it is like “pulling-teeth” to find material; these things don’t “just write themselves”…. So a very special thanks to seven superstars that answered the data call with achievements that allowed us to win Platinum awards for the Chapter: Dr. Keith Willet, Dr. David Flanigan, Zane Scott, Michael Pafford, Don York, Howard Lysick, and James Armstrong – everyone owes you a special thank-you!
Special thanks also to the Communications and Programs Directors and each of the Board of Directors for the INCOSE Chesapeake Chapter. And a big thanks to all of our partners, volunteers, and sponsors for making this another rewarding year for the SE and STEM communities that the Chapter supports.
- Monthly Newsletters – INCOSE-Chesapeake Chapter (CC) publishes a monthly newsletter distributed to Chapter members and made available on-line to INCOSE members at large. The key objective of the newsletter is to capture current and planned INCOSE-CC events including guest presentations; planned INCOSE International meetings or events; link to our current and past presentations on YouTube and associated after-action reports; INCOSE-CC President’s Point of View article on relevant topics; any book reports or musings; advertisement for INCOSE-CC sponsors, training opportunities, job postings; summary of our Chapter Membership, including SEP membership; and general Chapter information on the Board of Directors, volunteering, and other administrative data.
- Monthly Professional Presentations – INCOSE-CC hosts and sponsors a monthly dinner and presentation from SE and Other Professionals on topics of interest for its members and extended SE and STEM communities. After February 2020, all events were held virtually due to COVID, with excellent presentations via ZOOM from the guest speakers. Topics vary from SE-related technical presentations to how the SE discipline can be applied to everyday business and personal activities, as well as related topics of interest on bettering the SE and STEM communities with broader topics of interest. Presentations can be viewed at the YouTube Channel.
- Our Technical Contributions and Engineering performance were extremely significant, and the BIG accomplishments were led by some of the Chapter’s stand-outs: Dr. Keith Willet, Dr. David Flanigan, Zane Scott, Michael Pafford, Don York, Howard Lysick, and James Armstrong, there were engineering presentations, seven papers at the INCOSE IS, a 3rd major Edition of Alexander Kosiakoff’s SE bible, two other books, and key pamphlets…… and an SE presentation, that was turned into a road-show on the timeliest of topics…. The Resiliency of Hospitals and the Public Health Care system. Chesapeake Chapter members did not break stride in continuing their technical contributions.
- Job Fairs and SE Mentoring
- Student STEM Activities
- Academic Scholarships
- Education and Training
- 2020 INCOSE-CC Annual Awards & Recognition Ceremony – This event was the brain-child of 1st-year Programs Director Clinton Hilliard, and although he was already awarded Most Valuable Director of 2020, expect more good things next year! On December 16, 2020, the INCOSE – Chesapeake Chapter hosted a special event via ZOOM with over 40 System Engineers to celebrate and exchange ideas to expand our horizon on how SEs can foster greater communication and professional engagement for various industries, Government, STEM community, and future potential candidates for Systems Engineering and STEM in general. But the primary focus for the event was to honor those Systems Engineering Professionals who earned their Certifications this past year and to thank the tremendous support the Chapter had received to make it another successful year and making a major impact on the Systems Engineering and STEM communities. Details on the event and behind the scenes information are available at our website.
- INCOSE International Events (IS and IW) – Chesapeake-CC actively participated in both of the major two events
- Book reports and Blogs and General Musings
A special note of thanks to Paul Martin, our Communications Director, for his innovation in managing the information engine that is the Chapter’s best way of accomplishing our mission of advocacy and promotion. Paul and his team continued improving the INCOSE-CC Website to present more relevant content, provide access to more resources and technical information, and provide a more user-friendly interface to all of our content. Chesapeake Chapter’s website provides a wealth of current and archived information related to Systems Engineering.
Overall, the INCOSE Chesapeake Chapter has enjoyed working with the community at large; engaging with various key partners and stakeholders to bring tools, technology, and processes to our membership; providing SE professional services and information by hosting monthly presentations, publishing papers, and providing SE training; sharing our SE knowledge and expertise to a broad audience including students and other professionals. The INCOSE Chesapeake Chapter is very grateful to all of our supporters and partners, and we believe that we will be able to continue the level of SE services for the upcoming year.
It has been an interesting year, it has been a tough year, but above all, it’s been a pleasure serving the SE community with the Chesapeake Chapter.
It was my privilege and my honor to serve as your President,
~~Mark Evans
4. Systems Engineering News
4.1 The PPI-INCOSE Systems Engineering Tools Database (SETDB) is now live!
Explore the beta version online now. This limited version will remain open while extra functionality is implemented and tool vendors populate the database. Give feedback online via the ‘Contact SETDB’ quick link at the bottom of the explorer pages. From version 1, access will be limited to PPI alumni and guests and INCOSE members. If you are a tool vendor, you may register for use of the SETDB and enter your tools at the beta site.
https://www.systemsengineeringtools.com
4.2 SysML_v2 Schedule
The initial submission of the Systems Modeling Language SysML v2 specifications to the Object Management Group (OMG) was made by the SysML v2 Submission Team (SST) in August 2020. The plan is to present the final submission to the OMG in September of this year (2021). The final submission then gets voted on by the OMG for adoption. If it passes, it goes through a finalization task force process to ready the specifications for public release, which could take up to another year (September 2022). The team is hopeful that SysML v2 modeling tools will be available by that time, but that is up to the tool vendors.
A pilot implementation exists and which the SST uses to validate the requirements for the language, and to ensure the feasibility of the language. The SST releases a monthly update of the pilot implementation to a public site. However, this implementation currently only supports creating models using the textual notation. There is also only limited capability to generate graphical renderings of the model.
Thanks to Sanford Friedenthal, OMG SE DSIG Chair, SST Co-Lead for this update.
4.3 Systems Engineering Internship at ISAE-SUPAERO Development of Nanosat pre-sizing application
A mission analysis software has been developed at ISAE-Supaero. This tool is dedicated to compute the first sizing during a NanoSat mission development. The main goal is to determine all the useful budgets for a system engineer (mass, power, data, battery DOD, link…) given the mission orbit parameters and needs. Such budgets are critical during the first phase (phase 0) of a Cubesat development as they allow to detect the main sizing issues to solve during the following design phase (phase A). Later on, an automated tool to compute the main sizing parameters would be a great advantage for a system engineer to quickly detect any issue during the design process. The developed software will be used on a real mission: CREME (Cubesat for Radiation Environment Monitoring Experiment), a CubeSat currently designed to measure radiation levels in the Van Allen Belts.
During the internship, the applicant will have to:
- Become familiar with the main existing sizing tools.
- Identify and develop new functions in the mission analysis software (define satellite modes as user inputs, orbit visualization…). The main used language is Python3.
- Development of System Analysis tools (N2 diagram, design graphs, design structure matrixes…)
- Test and document the new development.
Internship’s objectives:
- Analyze the Creme current design, methodology, models and tools.
- Integrate those needs in a pre-sizing software developed (Python and web technologies).
- Test, document, and validate developments.
Technical Required skills: Good programming skills (Python) and methodology -Unit tests, code versioning… – System engineering, knowledge in space mechanism would be a real advantage.
Personal Required skills: Rigorous, scientific curiosity, autonomous, initiative spirit. Application: if interested, contact jerome.puech@isae.fr, thibault.gateau@isae.fr or sophia.salas-cordero@isae.fr by mail using the subject “[CREME] application for preliminary design tools internship”.
4.4 INCOSE 2020 Product of the Year Award
John Clark
In revising the “Guide to Writing Requirements,” the Requirements Working Group engaged a large team of authors and reviewers from across INCOSE Technical Operations to produce a document that has generated interest not only for personal use, but also as a foundation for systems engineering training courses and SE tools across the world.
4.5 Dr. Keith Willet Discusses Systems Engineering the Conditions of Possibility
Traditional systems engineering inclination is on cause-and-effect. When we turn a wheel, pull a lever, or flip a switch we expect certain outcomes. This rules-based approach is where stimulus-response is expected as deterministic, well-defined, well-bounded, finite, and predominantly rigid in its nature. If there is deviation from expected, there are simple systemic structures (logic gates) or simple rules (if-then-else) that provide optional courses of preplanned actions. Human intervention provides the intelligence and actions that are necessary for dynamic adjustment to a negative event (adversity, avoid loss); or, to detect and dynamically adjust to a positive event (opportunity, seek gain). The now and future discipline of systems engineering (SE v2.0) has tools to transcend this cause-effect approach and effectively embrace the nondeterministic, the openly defined, the blurred-boundary, the highly combinatorial if not infinite, and the adaptable. Systems engineers must design solutions to adapt to predictable and unpredictable change in order for the system to remain viable in the face of adversity (loss-driven) and relevant in the face of obsolescence (opportunity-driven). In addition to cause and effect, SEv2.0 is systems engineering the conditions of the possibility.
4.6 Seminar Presentations Concerning Systems Engineering Concepts
The Engineering and Technology Directorate (ETD) at NASA Goddard Space Flight Center (GSFC) USA is sponsoring a series of seminar presentations on Systems Engineering concepts, philosophies, principles, and practices. Presentations are generally once a month at GSFC. Most presentations will be streamed live over the web.
Find out more: https://ses.gsfc.nasa.gov/
4.7 Upcoming Open Training on Arcadia and Capella
Thales will be running an online Capella professional on April 12-19 2021. Animated by one of the Thales #MBSE experts, the course addresses the Arcadia method and the Capella tool, introduces Model-Based Systems Engineering (MBSE), and implements the method and the tool on a simple case-study. The course is delivered in English through 6 sessions of 3.5 hours each.
Contact for registration and pricing: stephane.lacrampe@obeosoft.ca
4.8 INCOSE Award Nominations
INCOSE strives to recognize those who contribute to the advancement of the systems engineering profession as well as the advancement of its organization. To submit a nomination for an INCOSE member who you believe is doing an outstanding job, check out nomination deadlines and information here.
5. featured organizations
5.1 Centre for Systems Engineering and Innovation Imperial College London
The Centre for Systems Engineering and Innovation supports the application of systems engineering in the construction sector. The aim is to bring world class research on systems engineering and innovation into the sector to transform production of the built environment.
The Centre acts as a hub for related inter-disciplinary research across campus on both systems engineering and innovation as applied to buildings and infrastructure.
From the website:
“We work collaboratively with leading engineers and managers to achieve our aim through research, executive education and inspiring the next generation of engineers.”
5.2 World Organization of Societal Systems Engineering (WOSSE)
WOSSE’s vision is to engineer sustainable societies in the world by developing Societal Capital through an integrated knowledge framework based on engineering, management and social sciences.
The following information is taken from the WOSSE website:
What we intend to achieve
To provide break-through systems-based solutions to solve societal problems, complex business initiatives, and government and institutional challenges. Often this will involve the combination of “hard systems” based on controllable technology and “soft systems” based on more open-ended human and societal interactions. For example, energy solutions in a society involve technical, scientific, environmental, political, and societal systems. This requires a new methodology to model and consider the broad systems construct and solution.
Why is this important
Our goal is to improve quality of life by empowering individuals, societies, and organizations to go beyond incomplete point solutions. Rather than a one-dimensional objective like Revenue or GDP, we want to broaden solutions for societies and organizations to build “Societal Capital”, “Organizational Capacity”, and “Sustainable Adaptability.”
This is critical in today’s world, where societal and technological complexity, when under-addressed, is driving grid-lock, inefficiencies, systems failures, and non-sustainability. At the same time, technology, knowledge, and modern institutions could be managed to provide creative and innovative business and societal systems solutions following the SSE. We address Societal Systems cultural, environmental, ecological & environmental resource shortage, business, and technological problems through systems solutions following the SSE framework and Societal Systems Thinking (SST), which includes the following four dimensions:
- Societal Systems Sustainability Thinking,
- Soft Systems Thinking,
- Hard Systems Thinking,
- Societal Systems Thinking Essential.
How you can make an impact
We invite you to join as a community member, solution partner, or learning and certification partner. Our intention is to develop societal solutions and share and advance this through a community of Worldwide Societal Systems Engineers. As a member, you would enter into a community dedicated to developing and learning about systems solutions, both for societal needs, as well as institute and business sustainability.
5.3 UTC Institute for Advanced Systems Engineering
The UTC-IASE serves as a hub for world-class research, project-based learning by globally-distributed teams of students, and industrial outreach activities focused on model-based systems engineering (MBSE) of complex systems that are built from, and are dependent on, the synergy of computational and physical components. The convergence of computation, communications, control, and intelligence enables cyber physical systems (CPS) to have learning and predictive capabilities able to adapt to changing situations. Motivated by the increasing complexity of advanced products and the digital revolution, the Institute trains engineers in urgently needed CPS-related disciplines that are pivotal to innovation and product enhancement in the globally competitive economy. The Institute is positioned to advance the science base of CPS and to accelerate its technological translation into sustained industrial growth.
6. News on Software Tools Supporting Systems Engineering
6.1 New Capella release: version 5.0.0
The Capella annual major release is out! Capella 5.0.0 major release includes usability and performance improvements, as well as multiple bug fixes. Capella deployment is now easier as it embeds Java directly.
The release note for Capella 5.0.0 is available here: https://github.com/eclipse/capella/wiki/Release-Notes-5.0.0
The Capella team is organizing a free Webinar on the 25th February, register here: http://bit.ly/CapellaWebinar_WhatsNew_Registration
Capella is a free and open-source MBSE software; it can be downloaded from this page: https://www.eclipse.org/capella/download.html
6.2 PTC Completes Acquisition of Arena Solutions
PTC has completed its acquisition of Arena Solutions, a software as a service (SaaS) product lifecycle management (PLM) solution. The combination of Arena Solutions and Onshape, which PTC acquired in 2019, establishes PTC as a provider of pure SaaS solutions for the product development market.
Read more here
6.3 3SL Announces the Release of Cradle 7.6
3SL has announced the release of Cradle 7.6 which includes new risk management, test execution and test management capabilities.
From the 3SL website:
a Linux installer, improved project setup features, extended user preferences such as text sizing and the ability to color items in project setup according to symbol type on a diagram.
Read about other additional features and enhancements here.
7. Systems Engineering Publications
7.1 Tools of Systems Thinkers: Learn Advanced Deduction, Decision-Making, and Problem-Solving Skills with Mental Models and System Maps
by
![Tools of Systems Thinkers: Learn Advanced Deduction, Decision-Making, and Problem-Solving Skills with Mental Models and System Maps. (The Systems Thinker Series Book 6) by [Albert Rutherford]](https://www.ppi-int.com/wp-content/uploads/2021/02/tools-of-systems-thinkers-learn-advanced-deductio-5.jpeg)
From the Amazon.com Website:
Think with clarity, depth, and speed. Become an effective problem solver and decision maker. We often have blind spots for the actual reasons that cause problems in our lives. So we try to fix our issues based on assumptions, false analysis, and mistaken deductions. This can bring a lot of misunderstanding, anxiety, and frustration into our personal and work relationships.
This book shares powerful strategies to organize your thoughts into transparent patterns and find the real roots of your problems and fix them once and for all. Notice details others miss. See through complexity. Resist jumping to conclusions prematurely. Evaluate information correctly and consistently to make better decisions. Stop sabotaging your self-interest. Overwrite your autopilot with logical and analytical tools. Learn to utilize mental models and system maps to your greatest advantage.
Mental models provide transparency, order, deeper understanding, and context to your problem. System maps can become your leading cognitive tool to find a clear solution that lasts.
Albert Rutherford is an internationally bestselling author and a retired corporate executive. His books draw on various sources, from corporate system building, organizational behavior analysis, scientific research, and his life experience. He has been building and improving systems his whole adult life and brings his proven strategies to you.
- Apply five mental models and system maps.
- Create a visual representation of complex problems with dynamic systems.
- Use system tools to fix your everyday problems.
- Take advantage of examples and exercises.
- Make smart and clear decisions.
Change your way of thinking. Master analytical, critical, and creative thinking. Become a systems thinker and discover how to approach your life from an entirely new perspective.
Publisher: ARB Publications; 1st edition (January 4, 2021)
Format: Kindle
ASIN: B08S1QYHKT
7.2 Clean Architecture: A Craftsman’s Guide to Software Structure and Design
by
From the Amazon.com Website:
Martin’s Clean Architecture doesn’t only present options. Drawing on over a half-century of experience in software environments of every imaginable type, Martin tells you what choices to make and why they are critical to your success. As you’ve come to expect from this author, this book is packed with direct, no-nonsense solutions for the real challenges you’ll face–the ones that will make or break your projects.
- Learn what software architects need to achieve, and core disciplines and practices for achieving it.
- Master essential software design principles for addressing function, component separation, and data management.
- See how programming paradigms impose discipline by restricting what developers can do.
- Understand what is critically important and what is merely a “detail”.
- Implement optimal, high-level structures for Web, database, thick-client, console, and embedded applications.
- Define appropriate boundaries and layers and organize components and services.
- See why designs and architectures go wrong, and how to prevent (or fix) these failures.
Clean Architecture is essential reading for every current or aspiring software architect, systems analyst, system designer, and software manager–and for every programmer who must execute someone else’s designs.
Publisher: Pearson; 1st edition (September 10, 2017)
Format: Kindle, Paperback
ISBN-10: 0134494164
ISBN-13: 978-0134494166
About the Author
Robert C. Martin has been a programmer since 1970. He is founder of Uncle Bob Consulting, LLC, and cofounder with his son Micah Martin of The Clean Coders LLC. Martin has published dozens of articles in various trade journals and is a regular speaker at international conferences and trade shows. He has authored and edited many books, including: Designing Object Oriented C++ Applications Using the Booch Method, Patterns Languages of Program Design 3, More C++ Gems, Extreme Programming in Practice, Agile Software Development: Principles, Patterns, and Practices, UML for Java Programmers, Clean Code, and The Clean Coder. A leader in the industry of software development, Martin served for three years as editor-in-chief of the C++ Report, and he served as the first chairman of the Agile Alliance.
7.3 What Is a Complex System?
by
James Ladyman, Karoline Wiesner
From the Amazon.com Website:
What is a complex system? Although “complexity science” is used to understand phenomena as diverse as the behavior of honeybees, the economic markets, the human brain, and the climate, there is no agreement about its foundations. In this introduction for students, academics, and general readers, philosopher of science James Ladyman and physicist Karoline Wiesner develop an account of complexity that brings the different concepts and mathematical measures applied to complex systems into a single framework. They introduce the different features of complex systems, discuss different conceptions of complexity, and develop their own account. They explain why complexity science is so important in today’s world
Publisher: Yale University Press (August 5, 2020)
Format: Paperback
ISBN10: 0300251106
ISBN13: 978-0300251104
7.4 Introduction to the Theory of Complex Systems
by
Stefan Thurner, Rudolf Hanel, and Peter Klimek
From the Amazon.com Website:
This book is a comprehensive introduction to quantitative approaches to complex adaptive systems. Practically all areas of life on this planet are constantly confronted with complex systems, be it ecosystems, societies, traffic, financial markets, opinion formation and spreading, or the internet and social media. Complex systems are systems composed of many elements that interact strongly with each other, which makes them extremely rich dynamical systems showing a huge range of phenomena. Properties of complex systems that are of particular importance are their efficiency, robustness, resilience, and proneness to collapse.
The quantitative tools and concepts needed to understand the co-evolutionary nature of networked systems and their properties are challenging. The book gives a self-contained introduction to these concepts, so that the reader will be equipped with a toolset that allows them to engage in the science of complex systems. Topics covered include random processes of path-dependent processes, co-evolutionary dynamics, dynamics of networks, the theory of scaling, and approaches from statistical mechanics and information theory. The book extends beyond the early classical literature in the field of complex systems and summarizes the methodological progress made over the past 20 years in a clear, structured, and comprehensive way.
Publisher: Oxford University Press (December 4, 2018)
Format: Hardcover
ISBN10: 019882193X
ISBN13: 978-0198821939
7.5 INCOSE Model-Based Capabilities Matrix
The INCOSE Model-Based Capabilities Matrix (MBCM) is a tool to help organizations that have already decided to implement digital engineering or model-based capabilities assess, and then plan the development of these capabilities in a comprehensive and coherent manner. It is a tool for organizational transformation and development, providing a set of capabilities and organizational implementation stages that are used for the conversion, planning, and resulting assessment of capabilities.
The scope of the organization utilizing this matrix may be the entire enterprise/business unit, program/product line, project/product, or some other level of organization. The models being discussed may be descriptive models or analytical models. The role-based view of the model-based capabilities may be suitable for specific roles to take-action: enterprise manager, system engineer, program manager, modelers, information technology representative, training, and human resources. The other matrix view of capabilities is the allocation of capabilities to the five goals listed in the United States Office of the Secretary of Defense (OSD) Digital Engineering (DE) Strategy document. U.S. Government organizations familiar with the OSD DE Strategy may want to use this matrix capability view to maintain or demonstrate traceability among their organization’s capabilities, the OSD DE Strategy, and transformation plans.
The Matrix is intended to serve as a starting point for the various organizational use cases. In most instances, the wording and level of detail will be tailored for specific applications and organizations. A section on tailoring is provided.
The purpose of the Guide is to provide approaches on how to use the Matrix for the following purposes:
- Organizational self-assessment.
- Enterprise-wide assessment of a portfolio of projects/program organizations.
- Role-based capabilities assessment for stakeholders in the organizational development.
- DE Strategy Goals view to maintain or demonstrate traceability among their organization’s capabilities, the OSD DE Strategy, and transformation plans.
- Providing the strategic basis for qualifying bidders and/or planning for the acquirer’s pre-award process leading to a source selection and contract award.
The Matrix is an Excel Spreadsheet (96KB) and an associated PDF Users Guide (869KB) is included in the 860KB zipped download.
Download the Matrix and PDF User Guide (INCOSE Membership Access Required)
7.6 Systems Thinking: Managing Chaos and Complexity: A Platform for Designing Business Architecture
by
From the Amazon.com Website:
Systems Thinking, Third Edition combines systems theory and interactive design to provide an operational methodology for defining problems and designing solutions in an environment increasingly characterized by chaos and complexity. This new edition has been updated to include all new chapters on self-organizing systems as well as holistic, operational, and design thinking.
The book addresses crises in financial systems and job markets, the housing bubble, and environment, assessing their impact on systems thinking.
This volume is ideal for senior executives as well as for chief information/operating officers and other executives charged with systems management and process improvement. It may also be a helpful resource for IT/MBA students and academics.
Publisher: Morgan Kaufmann; 3rd edition
Format: Kindle, Paperback
ISBN10: 0123859158
ISBN13: 978-0123859150
8. Education and Academia
8.1 Master’s in Systems Engineering Leadership at Worcester Polytechnic Institute Worcester, Massachusetts USA
The Systems Engineering Program at Worcester Polytechnic is led by Dr. Don Gelosh, ESEP-Acquisition.
The learning outcomes of this program are:
- Gain a breadth of knowledge in systems engineering, as well as management and leadership topics.
- Learn to lead diverse teams through systems thinking skill building.
- Become adept at managing people, as well as project finances.
- Expand business acumen while designing and maintaining complex systems.
- Achieve cost and schedule objectives on multidisciplinary projects.
WPI’s partnership with the International Council on Systems Engineering (INCOSE) helps WPI students achieve professional recognition and certification as a systems engineer.
Through the Global Projects Program within The Global School, WPI science, engineering, and business students can immerse themselves in new cultures and tackle unstructured, real-world problems in ways that are meaningful to local sponsors in real communities. WPI’s diverse project centers—strategically positioned in locations ranging from large international cities to small mountainside villages—are host to interdisciplinary and major Capstone projects, and humanities and arts projects. WPI students can participate in language immersion and exchange programs. The WPI students can have a global impact no matter where they are—even from their desktop.
More Information
https://www.wpi.edu/academics/online/study/systems-engineering-ms
https://www.wpi.edu/project-based-learning/project-based-education/global-project-program
8.2 New Technology and Team Driven Innovation Certificate Program University of California Irvine (USA) Division of Continuing Education
“Students in the program will become proficient with product development tools and processes, examine various technologies that drive innovation, use project management and systems engineering methodologies, and learn to apply workflow practices in different scenarios. They will also learn to use tools, procedures, and technologies to nurture originality, motivate staff, connect with and inspire employees, increase productivity, shorten development cycles, and navigate issues.”
The certificate provides technical and professional skills development along with a roadmap for technology-oriented organizations and professionals to drive innovation through teams and enabling technologies.
To attain the certificate, learners must complete five courses (12 units) as follows:
- Driving Innovation through Technology and Meaning
- Systems Engineering and Technical Project Management
- Innovation and the Technical Professional
- Leading Technical Teams
- The Innovative Technical Organization
8.3 Internet-Based Testing for Students and Professionals
On Wednesday, January 20th, 2021, INCOSE hosted its Webinar #146 on “Internet-Based Testing for Students and Professionals”, presented by Courtney Wright, Bhautik Vadher, and Rick Grandrino.
This webinar compared the perspectives of university instruction and professional certification regarding the impact of COVID-19 on accelerating the push to remote testing, the logistics of preparing and conducting such testing, and the deterrence, detection, and consequences of cheating during such testing.
A recording of Webinar 146 is available in the INCOSE Webinars Library (INCOSE login required).
9. Some Systems Engineering – Relevant Websites
Systems Engineering Leadership Institute (Research Focus Areas)
On this site materials are available concerning implementation of systems engineering, reliability and risk, systems thinking as an enabler for innovation, an innovative curriculum for engineering in high school, a systems approach to education, and a blog: An Engineer’s Insight that is addressed to systems engineering and systems thinking.
https://web.wpi.edu/research/seli/resear63.html
IEEE Xplore
IEEE Xplore provides online searching of content of IEEE standards, journals, books, and other publications. IEEE is a technical professional organization dedicated to advancing technology for the benefit of humanity. IEEE is active in systems engineering and engineering management, in addition to many other domains.
https://ieeexplore.ieee.org/Xplore/home.jsp
Videos Provided by the UTC Institute for Advanced Systems Engineering
This Website provides a large number of videos concerning a wide variety of systems engineering topics. Some examples are:
- Systems Engineering Transformation
- Meet Advanced Engineering!
- Applying Systems Engineering to the Development of Healthcare Capabilities
- When is Complex too Complex? Graph Energy, Proactive Complexity and the First Law of Systems Engineering by Oliver de Weck
- Introduction to the Body of Knowledge and Curriculum to Advance Systems Engineering Project (BKCASE)
- Advanced Design System Introduction
View the Videos here
Worldwide Directory of Systems Engineering and Industrial Engineering Academic Programs
The International Council on Systems Engineering (INCOSE) and the Systems Engineering Research Center (SERC) at Stevens Institute of Technology have developed this directory as a resource for the industrial and systems engineering community, and we intend to update it annually.
The information contained in this World Wide Directory was primarily drawn from university websites. For each university, the directory lists the name and address of that university, the degrees offered by that university, the academic unit that offers those degrees, the head of the academic unit offering those degrees, and a URL where more information can be found.
Institutions that wish to include their programs in this directory, or make an addition or correction to their existing information in the directory, should contact ISEDirectory@stevens.edu; and include the name of the institution, location, URL for the English language page providing program information, and point of contact information.
10. Standards and Guides
10.1 SESA Involvement in Systems Engineering Standards
![]()
SESA participates through the Standards Australia Technical committee IT-015 Software and Systems Engineering, which is the National body representing Australia on the international technical committee ISO/IEC JTC1/SC7 by the same name. SESA also partners with the INCOSE Standards Initiative as a Category A liaison to ISO/IEC JTC1/SC7 that provides editors and working group conveners for a number of the keystone standards that underpin the SE discipline.
Key among these standards is ISO/IEC/IEEE 15288:2015 Systems Engineering Life Cycle Processes, edited by Garry Roedler, the INCOSE Immediate Past President. SESA, through its Engineering Process Standards Working Group, played a significant role in the curation of all of these Life Cycle Process standards. Garry will again be leading the next revision of this standard (see 10.2). ISO/IEC/IEEE 15288 is elaborated by the INCOSE SE Handbook which encapsulates the Systems Engineering Body of Knowledge (SEBoK). This Handbook is the basis of the INCOSE Knowledge exam, which is a baseline component of the INCOSE SEP Certification. A Certified Systems Engineering Professional (CSEP) certification is a requirement to become a Chartered Australian Systems Engineer (CASE) recognized under a Mutual Recognition Agreement (MRA) with Engineers Australia.
SESA members to IT-015 are currently participating in the editing and balloting of ISO/IEC 24773 Certification of Software and Systems Engineering Professionals – Part 3: Systems Engineering.
This will provide an international standard set of requirements against which Certification Bodies must comply should they wish to certify Systems Engineers. When published this will form the basis of a renegotiated MRA due for refresh in 2021.
Revisions of the documents listed above will be maintained. If you wish to make a significant contribution to the advancement of the Systems Engineering profession by contributing to the development of these foundational documents please notify standards@sesa.org.au. Please contact case_manager@sesa.org.au if you are interested in finding out more about CASE.
Overview of the SC Standards Collection
10.2 ISO/IEC/IEEE 15288:2015 Systems and Software Engineering – System Life Cycle Processes
ISO/IEC/IEEE 15288 2015 establishes a common framework of process descriptions for describing the life cycle of systems created by humans. It defines a set of processes and associated terminology from an engineering viewpoint. These processes can be applied at any level in the hierarchy of a system’s structure.
The goal of the 15288 standard is to establish a common lexicon for the activities executed within a systems engineering endeavor. The intended audience of the standard are those in the practice and leadership of systems engineering. This audience may include operations analysts, system architects, engineers, systems developers, computer scientists and project managers.
ISO/IEC/IEEE 15288 references phases defined in ISO/IEC TR 24748-1 which lists the generic phases of the systems life cycle as: concept, development, production, utilization, support and retirement.
A systems engineering endeavor involves the execution of the technical, technical management and agreement activities during each phase of the lifecycle. This standard points out several key points concerning systems engineering activities, organizations, and the systems lifecycle:
- The standard implies a sequence of the phases within the lifecycle; however these phases often overlap and are recursive.
- The phases depicted are generic and may not fully define all phases of a system’s maturation.
- The activities may be executed multiple times across multiple phases of the life cycle.
- The methods in which a life cycle can be executed are based on factors such as level of up front planning, clarity of the problem space, urgency to achieve incremental capabilities, and funding streams.
ISO 15288 is currently in the process of being updated in an led by editors Garry Roedler and Bernado Delicao. The anticipated release of the standard is 2023.
Editor’s Note: PPI does not recommend the current version of the standard (ISO/IEC/IEEE 15288:2015). Our concerns are documented in a 25 page Application Guide which you may download here https://www.ppi-int.com/wp-content/uploads/2021/01/242KB.pdf ; cognizance of these issues can increase the likelihood of the standard being beneficial to engineering outcomes.
10.3 SAE International Launches OnQue Digital Standards System
SAE International announced today the launch of the SAE OnQue™ Digital Standards System, a first-of-its-kind system that delivers SAE’s expansive library of engineering standards digitally. As a trusted resource in engineering standards, SAE digitally delivers its expansive library of knowledge to aerospace engineers through the OnQue Digital Standards System to help simplify the product development process by helping maintain data integrity, reducing process complexity, and digitally connecting standards to the products and processes on which they are based.
“The aerospace industry is rapidly evolving, and engineers are under constant pressure to innovate the products they design and develop safely, quickly and efficiently. The OnQue Digital Standards System was developed with these challenges in mind to enable better standards integration into engineering workflows for product development, product performance and quality management,” stated Frank Menchaca, chief growth officer at SAE International. “As a leading standards development organization with more than 8,000 aerospace and systems management standards published over the past century, SAE continues to partner with the industry to offer solutions that help make engineers jobs easier.”
OnQue Digital Standards System is an intelligent solution that revolutionizes the delivery of standards while enhancing their utility. Using the system’s digital interface, aerospace customers are able to:
Link and integrate industry standards to product definitions and development tools that support model-based engineering, systems engineering, digital twin and other applications requiring systems integration.
Support compliance with change management functionality including immediate notifications when standards have been updated or revised.
Rapidly discover relevant or comparable parts and materials, along with the associated SAE standard, based on design constraints through the cloud-based, interoperable engineering data system.
Prior to launching the OnQue Digital Standards System, SAE collaborated with a group of strategic development partners, including aerospace industry leaders. The industry partnerships helped create, refine and implement the solution, utilizing the industrial expertise of each organization to explore how to effectively integrate the system into practical engineering applications.
11. Some definitions to close on
11.1 Performance Measurement
“Performance Measurement: the process of collecting, analyzing, and/or reporting information regarding the performance of an individual, group, organization, system or component. Definitions of performance measurement tend to be predicated upon an assumption about why the performance is being measured.”
Source: Wikipedia
“Performance Measurement: the process of collecting, analyzing and/or reporting information regarding the performance of an individual, group, organization, system or component.
Source: Behn, Robert D. (2003). Why measure Performance? Different Purposes Require Different Measures.
“Performance Measurement: “Performance measurement estimates the parameters under which programs, investments, and acquisitions are reaching the targeted results”.
Source: Office of the Chief Information Officer (OCIO) Enterprise Architecture Program (2007).
“Performance Measurement: “the process of evaluating how well organizations are managed and the value they deliver for customers and other stakeholders”.
Source: Moullin, M. (2007) ‘Performance measurement definitions. Linking performance measurement and organizational excellence’, International Journal of Health Care Quality Assurance, 20:3, pp. 181-183.
Performance Measurement: “the process of quantifying the efficiency and effectiveness of past actions”.
Source: Neely, A.D., Adams, C. and Kennerley, M. (2002), ‘The Performance Prism: The Scorecard for Measuring and Managing Stakeholder Relationships’, Financial Times/Prentice Hall, London.
11.2 System Integration
System integration is defined in engineering as the process of bringing together the component sub-systems into one system (an aggregation of subsystems cooperating so that the system is able to deliver the overarching functionality) and ensuring that the subsystems function together as a system, and in information technology as the process of linking together different computing systems and software applications physically or functionally, to act as a coordinated whole.
Source: Wikipedia
The process of creating a complex information system that may include designing or building a customized architecture or application, integrating it with new or existing hardware, packaged and custom software, and communications. Most enterprises rely on an external contractor for program management of most or all phases of system development. This external vendor generally also assumes a high degree of the project’s risks.
Source: Gartner
System integration (SI) is an IT or engineering process or phase concerned with joining different subsystems or components as one large system. It ensures that each integrated subsystem functions as required.
SI is also used to add value to a system through new functionalities provided by connecting functions of different systems.
Source: Techopedia
12. Conferences and Meetings
For more information on systems engineering related conferences and meetings, please proceed to our website.
The featured conference for this month is:
The 11th Israeli International Conference on Systems Engineering
Systems Engineering in the Age of Disruptions and Transformations
16 – 17 March 2021 (Virtual Event)
During the last year, the world witnessed significant transformations to our reality, disrupting existing systems and affecting the development of new systems. Disruptions like COVID-19 or digitization change the way we are used to thinking and acting. At the 11th International Conference on Systems Engineering, the 11th Israeli International Conference on Systems Engineering will attempt to grasp the changes that such and other disruptions demand from us, Systems Engineers, when we respond to today’s and future challenges.
Conference objectives
- Develop Systems Engineering professionalism.
- Promote Systems Engineering innovation, knowledge and experience sharing.
- Strengthen the connections between the Systems Engineering communities in Israel and abroad.
- Enhance the relations between Systems Engineers in industry, academia and government organizations.
Conference organization
- The conference will be conducted virtually, allowing participants from abroad to easily attend and enrich the audience with their expertise. Lectures will be presented in English enabling all participants to benefit.
- The two-day conference shall include keynote lectures and parallel sessions.
- Some lectures will be invited and others will be offered by the community, responding to the Call for Abstracts.
For more information on systems engineering related conferences and meetings, please proceed to our website.
13. PPI and cti News
13.1 A PPI Description of Systems Engineering
PPI has produced a number of definitions of systems engineering at different levels of abstraction and for use in different contexts. One PPI answer to the question ‘what is systems engineering?’ follows.
Systems engineering is a set of principles and supporting methods, based on systems thinking, for the successful engineering of solutions to problems.
The approach is based on process elements that are selected and integrated for use in response to a given set of circumstances, with the aim of maximizing the value delivered to applicable stakeholders, and having regard to uncertainty.
Mastery of systems engineering spans requirements analysis (requirements capture and validation), physical (structural) design, logical design, effectiveness evaluation and decision making (the conduct of trade studies), specification of system elements, system integration (building the system in development), verification of work products (job right?), validation of work products (right job?), integration of specialty engineering disciplines, and systems engineering management.
Together these process elements, applied recursively and with degrees of iteration dependent on novelty, complexity and stability of need, embrace the totality of systems engineering practice, when applied to socio-technical and technical systems, including systems for development, production, maintenance, retirement, disposal, and other system life cycle processes, as applicable.
13.2 PPI Welcomes John Fitch
PPI welcomes John Fitch to the PPI team. John, based in Garrett, Indiana, USA, joins the professional team as Principal Consultant. John is an innovator in systems engineering methods and tools, especially in the area of decision support. John retired from his full-time consulting business Decision Driven® Solutions in 2018, having created outstanding resources in the field of decision patterns, and related training. John, as a Principal Consultant member of the team, will increase PPI’s capacity for consulting and training delivery, especially in the United States.
13.3 Team PPI Attends the INCOSE International Workshop
Over the course of the INCOSE International Workshop 29 – 31 January 2021, PPI team members Robert Halligan, Randy Iliff, René King, Paul Davies, John Fitch, Eduardo Muñoz and Kevin Nortrup attended many presentations, work sessions and cafés on a wide range of topics including systems engineering heuristics and principles, integration project management and systems engineering, model-based and digital engineering, INCOSE Systems Engineering Handbook V5 updates, the Smart Cities Initiative and many more and walked away feeling enriched and inspired to continue our mission. Well done to INCOSE for executing its first ever virtual IW superbly. Read PPI Managing Director Robert Halligan’s reflections on the IW here.
14. PPI and CTI Events
https://www.ppi-int.com/ppi-live-online/
For a full public PPI training course schedule, please visit https://www.ppi-int.com/course-schedule/
For a full public CTI Live-Online™ INCOSE SEP Exam Preparation course schedule, please visit https://certificationtraining-int.com/incose-sep-exam-prep-course/
To enquire about CTI Live-Online™ INCOSE SEP Exam Preparation Training for your organization, please visit https://certificationtraining-int.com/on-site-training/
15. Upcoming PPI Participation in Professional Conferences
PPI will be participating in the following upcoming events. We support the events that we are sponsoring, and look forward to meeting old friends and making new friends at the events at which we will be exhibiting.
The INCOSE International Conference 2021
Date: 17 – 22 July 2021
Location: Honolulu, USA
Kind regards from the PPI SyEN team:
Robert Halligan, Editor-in-Chief, email: rhalligan@ppi-int.com
Dr. Ralph Young, Editor, email: syen@ppi-int.com
René King, Managing Editor, email: rking@ppi-int.com
Project Performance International
2 Parkgate Drive, Ringwood, Vic 3134 Australia
Tel: +61 3 9876 7345
Tel Brasil: +55 12 9 9780 3490 (Breno Bacci)
Tel UK: +44 20 3608 6754
Tel USA: +1 888 772 5174
Tel China: +86 188 5117 2867 (Victoria Huang)
Web: www.ppi-int.com
Email: contact@ppi-int.com
Copyright 2012-2021 Project Performance (Australia) Pty Ltd,
trading as Project Performance International
Tell us what you think of PPI SyEN. Email us at syen@ppi-int.info